ICICI Bank 2016 Annual Report Download - page 238
Download and view the complete annual report
Please find page 238 of the 2016 ICICI Bank annual report below. You can navigate through the pages in the report by either clicking on the pages listed below, or by using the keyword search tool below to find specific information within the annual report.-
 1
1 -
2
-
3
-
4
-
5
-
6
-
7
-
8
-
9
-
10
-
11
-
12
-
13
-
14
-
15
-
16
-
17
-
18
-
19
-
20
-
21
-
22
-
23
-
24
-
25
-
26
-
27
-
28
-
29
-
30
-
31
-
32
-
33
-
34
-
35
-
36
-
37
-
38
-
39
-
40
-
41
-
42
-
43
-
44
-
45
-
46
-
47
-
48
-
49
-
50
-
51
-
52
-
53
-
54
-
55
-
56
-
57
-
58
-
59
-
60
-
61
-
62
-
63
-
64
-
65
-
66
-
67
-
68
-
69
-
70
-
71
-
72
-
73
-
74
-
75
-
76
-
77
-
78
-
79
-
80
-
81
-
82
-
83
-
84
-
85
-
86
-
87
-
88
-
89
-
90
-
91
-
92
-
93
-
94
-
95
-
96
-
97
-
98
-
99
-
100
-
101
-
102
-
103
-
104
-
105
-
106
-
107
-
108
-
109
-
110
-
111
-
112
-
113
-
114
-
115
-
116
-
117
-
118
-
119
-
120
-
121
-
122
-
123
-
124
-
125
-
126
-
127
-
128
-
129
-
130
-
131
-
132
-
133
-
134
-
135
-
136
-
137
-
138
-
139
-
140
-
141
-
142
-
143
-
144
-
145
-
146
-
147
-
148
-
149
-
150
-
151
-
152
-
153
-
154
-
155
-
156
-
157
-
158
-
159
-
160
-
161
-
162
-
163
-
164
-
165
-
166
-
167
-
168
-
169
-
170
-
171
-
172
-
173
-
174
-
175
-
176
-
177
-
178
-
179
-
180
-
181
-
182
-
183
-
184
-
185
-
186
-
187
-
188
-
189
-
190
-
191
-
192
-
193
-
194
-
195
-
196
-
197
-
198
-
199
-
200
-
201
-
202
-
203
-
204
-
205
-
206
-
207
-
208
-
209
-
210
-
211
-
212
-
213
-
214
-
215
-
216
-
217
-
218
-
219
-
220
-
221
-
222
-
223
-
224
-
225
-
226
-
227
-
 228
228 -
 229
229 -
 230
230 -
 231
231 -
 232
232 -
 233
233 -
 234
234 -
 235
235 -
 236
236 -
 237
237 -
 238
238 -
 239
239 -
 240
240 -
 241
241 -
 242
242 -
 243
243 -
 244
244 -
 245
245 -
 246
246 -
 247
247 -
 248
248 -
249
-
250
-
251
-
252
 |
 |
Annual Report 2015-2016236
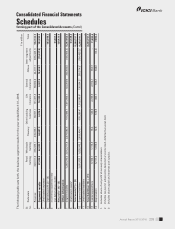
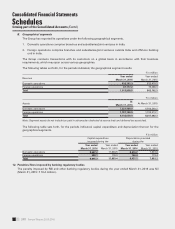
Schedules
forming part of the Consolidated Accounts (Contd.)
Consolidated Financial Statements
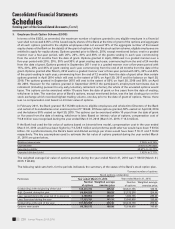
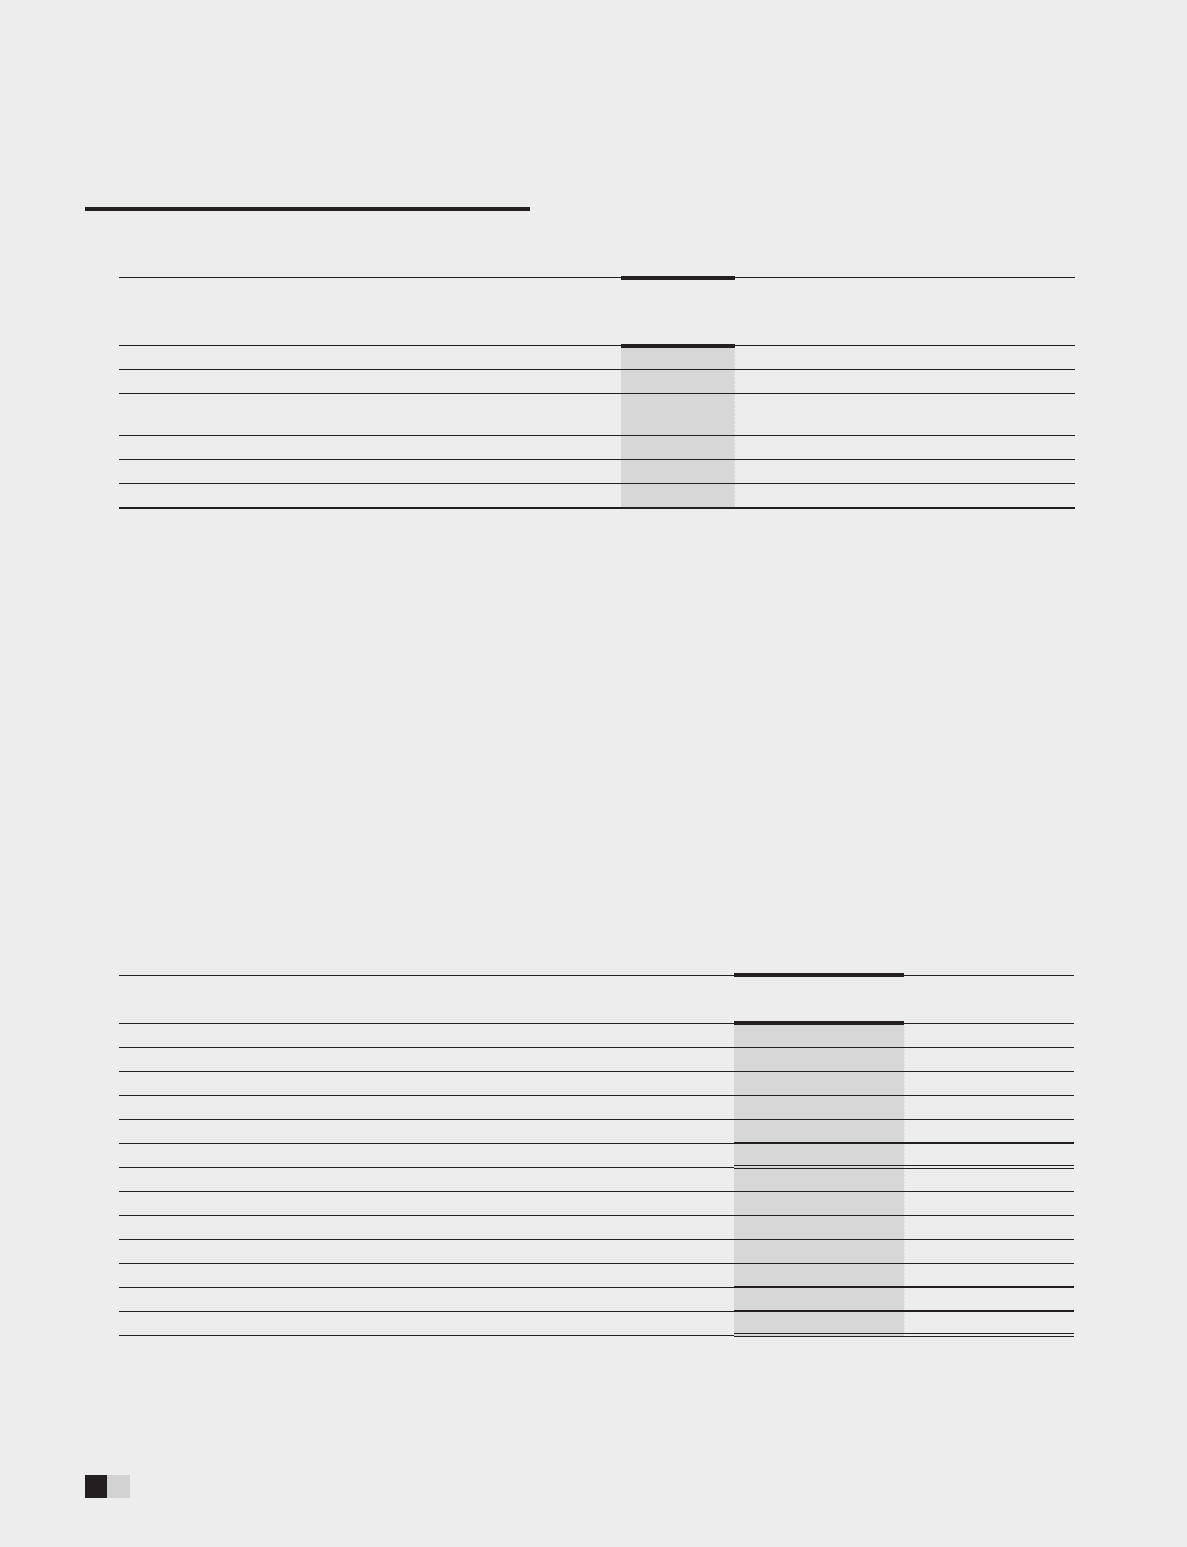
Experience adjustment
` in million
Particulars
Year ended
March 31,
2016
Year ended
March 31,
2015
Year ended
March 31,
2014
Year ended
March 31,
2013
Plan assets 23,209.5 20,683.7 18,352.7 16,136.8
Dened benet obligations (23,209.5) (20,683.7) (18,356.2) (16,136.8)
Amount not recognised as an asset (limit in para 59(b)) AS 15 on
‘employee benets’) –– – –
Surplus/(decit) –– (3.5) –
Experience adjustment on plan assets 27.1 347.0 (136.3) 17.3
Experience adjustment on plan liabilities 252.5 325.7 (9.9) 24.2
The Group has contributed ` 2,167.6 million to provident fund including Government of India managed employees
provident fund for the year ended March 31, 2016 (March 31, 2015: ` 2,030.3 million), which includes compulsory
contribution made towards employee pension scheme under Employees Provident Fund and Miscellaneous
Provisions Act, 1952.
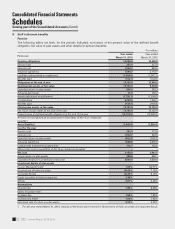
9. Provision for income tax
The provision for income tax (including deferred tax) for the year ended March 31, 2016 amounted to ` 33,775.0
million (March 31, 2015: ` 53,916.2 million).
The Group has a comprehensive system of maintenance of information and documents required by transfer pricing
legislation under sections 92-92F of the Income Tax Act, 1961. The management is of the opinion that all international
transactions are at arm’s length so that the above legislation will not have material impact on the nancial statements.
10. Deferred tax
At March 31, 2016, the Group has recorded net deferred tax asset of ` 49,611.9 million (March 31, 2015: ` 16,134.8
million), which has been included in “other assets”.
The following table sets forth, for the periods indicated, the break-up of deferred tax assets and liabilities into major
items.
` in million
Particulars At March 31, 2016 At March 31, 2015
Deferred tax asset
Provision for bad and doubtful debts 70,339.8 39,199.1
Capital loss –50.5
Foreign currency translation reserve15,877.5 –
Others 6,232.7 4,463.4
Total deferred tax asset 82,450.0 43,713.0
Deferred tax liability
Special reserve deduction 26,632.2 22,057.3
Depreciation on xed assets 5,329.4 5,359.9
Mark-to-market gains1715.4 –
Others 161.1 161.0
Total deferred tax liability 32,838.1 27,578.2
Total net deferred tax asset/(liability) 49,611.9 16,134.8
1. These items are considered in accordance with the requirements of Income Computation and Disclosure Standards.
2. Deferred tax asset/(liability) pertaining to foreign branches/subsidiaries is included in respective categories.