ICICI Bank 2016 Annual Report Download - page 97
Download and view the complete annual report
Please find page 97 of the 2016 ICICI Bank annual report below. You can navigate through the pages in the report by either clicking on the pages listed below, or by using the keyword search tool below to find specific information within the annual report.-
 1
1 -
2
-
3
-
4
-
5
-
6
-
7
-
8
-
9
-
10
-
11
-
12
-
13
-
14
-
15
-
16
-
17
-
18
-
19
-
20
-
21
-
22
-
23
-
24
-
25
-
26
-
27
-
28
-
29
-
30
-
31
-
32
-
33
-
34
-
35
-
36
-
37
-
38
-
39
-
40
-
41
-
42
-
43
-
44
-
45
-
46
-
47
-
48
-
49
-
50
-
51
-
52
-
53
-
54
-
55
-
56
-
57
-
58
-
59
-
60
-
61
-
62
-
63
-
64
-
65
-
66
-
67
-
68
-
69
-
70
-
71
-
72
-
73
-
74
-
75
-
76
-
77
-
78
-
79
-
80
-
81
-
82
-
83
-
84
-
85
-
86
-
 87
87 -
 88
88 -
 89
89 -
 90
90 -
 91
91 -
 92
92 -
 93
93 -
 94
94 -
 95
95 -
 96
96 -
 97
97 -
 98
98 -
 99
99 -
 100
100 -
 101
101 -
 102
102 -
 103
103 -
 104
104 -
 105
105 -
 106
106 -
 107
107 -
108
-
109
-
110
-
111
-
112
-
113
-
114
-
115
-
116
-
117
-
118
-
119
-
120
-
121
-
122
-
123
-
124
-
125
-
126
-
127
-
128
-
129
-
130
-
131
-
132
-
133
-
134
-
135
-
136
-
137
-
138
-
139
-
140
-
141
-
142
-
143
-
144
-
145
-
146
-
147
-
148
-
149
-
150
-
151
-
152
-
153
-
154
-
155
-
156
-
157
-
158
-
159
-
160
-
161
-
162
-
163
-
164
-
165
-
166
-
167
-
168
-
169
-
170
-
171
-
172
-
173
-
174
-
175
-
176
-
177
-
178
-
179
-
180
-
181
-
182
-
183
-
184
-
185
-
186
-
187
-
188
-
189
-
190
-
191
-
192
-
193
-
194
-
195
-
196
-
197
-
198
-
199
-
200
-
201
-
202
-
203
-
204
-
205
-
206
-
207
-
208
-
209
-
210
-
211
-
212
-
213
-
214
-
215
-
216
-
217
-
218
-
219
-
220
-
221
-
222
-
223
-
224
-
225
-
226
-
227
-
228
-
229
-
230
-
231
-
232
-
233
-
234
-
235
-
236
-
237
-
238
-
239
-
240
-
241
-
242
-
243
-
244
-
245
-
246
-
247
-
248
-
249
-
250
-
251
-
252
 |
 |

95Annual Report 2015-2016
lending rate comprises marginal cost of funds, negative carry on account of cash reserve ratio, operating costs and
tenor premium. The guideline has specied categories of loans which can be priced without linkage to the marginal
cost of funds based lending rate. Banks have to review and publish their marginal cost of funds based lending rate
every month on a pre-announced date for different maturities ranging from overnight rate to up to one year. The
periodicity of reset shall be one year or lower. Loans linked to the base rate can continue till repayment or renewal
with existing borrowers having the option to move to the marginal cost of funds based lending rate linked loan at
mutually acceptable terms. Earlier, banks were not permitted to extend xed rate loans at a rate of interest lower
than the base rate. This restriction no longer applies in the MCLR framework;
During the three months ended December 31, 2015, RBI articulated the objective of early and conservative
recognition of stress and provisioning, held discussions with and asked a number of Indian banks to review certain
loan accounts and their classication over the three months ended December 31, 2015 and the three months ended
March 31, 2016. As a result of the above factor, non-performing loans increased signicantly in the banking system
during the second half of scal 2016. RBI also directed banks to make an additional provision of 10% during the year
ending March 31, 2017 in respect of restructured loan accounts highlighted by RBI;
In March 2016, RBI issued guidelines expanding the eligibility for common equity Tier 1 capital to include 45.0% of
revaluation reserves, which earlier qualied for inclusion in Tier 2 capital, and 75.0% of foreign currency translation
reserves. The guidelines further allowed recognition of deferred tax assets arising due to timing differences,
excluding accumulated losses, as Tier 1 capital up to 10.0% of a bank’s common equity Tier 1 capital, in line with
the guidelines of the Basel Committee on Banking Supervision (BCBS); and
In March 2016, the Ministry of Finance revised the methodology for determining interest rates on various small
savings schemes. As per the guidelines, interest rates of such savings schemes would be reset every quarter based
on G-sec yields of the previous three months.
STANDALONE FINANCIALS AS PER INDIAN GAAP
Summary
Over the past two years, the domestic economic recovery has been gradual and the global economic environment has
become challenging. Fiscal 2016 witnessed a slowdown in global economic growth mainly on account of lower growth in
China and emerging market economies, divergence in global monetary policy and signicant decline in commodity prices
including crude oil and metals. Due to the increased level of risks in the business environment, the Indian banking system in
general has experienced an increase in the level of additions to non-performing loans including slippages from restructured
loans. During three months ended December 31, 2015, RBI articulated the objective of early and conservative recognition of
stress and provisioning, held discussions with and asked a number of Indian banks to review certain loan accounts and their
classication over the three months ended December 31, 2015 and three months ended March 31, 2016, through its Asset
Quality Review. As a result of the above factors, non-performing loans of the Bank increased signicantly in the second half
of scal 2016.
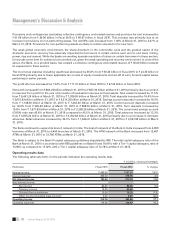
Prot before collective contingency and related reserve and tax decreased marginally from ` 158.20 billion in scal 2015
to ` 157.96 billion in scal 2016. The decrease in prot before collective contingency and related reserve was mainly due
to an increase in provisions for non-performing assets and a 10.3% increase in non-interest expenses, offset, in part, by
an 11.5% increase in net interest income and a 25.8% increase in non-interest income.
Net interest income increased by 11.5% from ` 190.40 billion in scal 2015 to ` 212.24 billion in scal 2016 reecting an
increase of 11.1% in the average volume of interest-earning assets.
Non-interest income increased by 25.8% from ` 121.76 billion in scal 2015 to ` 153.22 billion in scal 2016 primarily
due to an increase in income from treasury-related activities and fee income. Income from treasury-related activities for
scal 2016 included gains of ` 33.74 billion from sale of stake in ICICI Prudential Life Insurance Company Limited and
ICICI Lombard General Insurance Company Limited. Fee income increased by 6.4% from ` 82.87 billion in scal 2015 to
` 88.20 billion in scal 2016.
Non-interest expenses increased by 10.3% from ` 114.96 billion in scal 2015 to ` 126.83 billion in scal 2016 primarily
due to an increase in non-employee related expenses.