ICICI Bank 2016 Annual Report Download - page 71
Download and view the complete annual report
Please find page 71 of the 2016 ICICI Bank annual report below. You can navigate through the pages in the report by either clicking on the pages listed below, or by using the keyword search tool below to find specific information within the annual report.-
 1
1 -
2
-
3
-
4
-
5
-
6
-
7
-
8
-
9
-
10
-
11
-
12
-
13
-
14
-
15
-
16
-
17
-
18
-
19
-
20
-
21
-
22
-
23
-
24
-
25
-
26
-
27
-
28
-
29
-
30
-
31
-
32
-
33
-
34
-
35
-
36
-
37
-
38
-
39
-
40
-
41
-
42
-
43
-
44
-
45
-
46
-
47
-
48
-
49
-
50
-
51
-
52
-
53
-
54
-
55
-
56
-
57
-
58
-
59
-
60
-
 61
61 -
 62
62 -
 63
63 -
 64
64 -
 65
65 -
 66
66 -
 67
67 -
 68
68 -
 69
69 -
 70
70 -
 71
71 -
 72
72 -
 73
73 -
 74
74 -
 75
75 -
 76
76 -
 77
77 -
 78
78 -
 79
79 -
 80
80 -
 81
81 -
82
-
83
-
84
-
85
-
86
-
87
-
88
-
89
-
90
-
91
-
92
-
93
-
94
-
95
-
96
-
97
-
98
-
99
-
100
-
101
-
102
-
103
-
104
-
105
-
106
-
107
-
108
-
109
-
110
-
111
-
112
-
113
-
114
-
115
-
116
-
117
-
118
-
119
-
120
-
121
-
122
-
123
-
124
-
125
-
126
-
127
-
128
-
129
-
130
-
131
-
132
-
133
-
134
-
135
-
136
-
137
-
138
-
139
-
140
-
141
-
142
-
143
-
144
-
145
-
146
-
147
-
148
-
149
-
150
-
151
-
152
-
153
-
154
-
155
-
156
-
157
-
158
-
159
-
160
-
161
-
162
-
163
-
164
-
165
-
166
-
167
-
168
-
169
-
170
-
171
-
172
-
173
-
174
-
175
-
176
-
177
-
178
-
179
-
180
-
181
-
182
-
183
-
184
-
185
-
186
-
187
-
188
-
189
-
190
-
191
-
192
-
193
-
194
-
195
-
196
-
197
-
198
-
199
-
200
-
201
-
202
-
203
-
204
-
205
-
206
-
207
-
208
-
209
-
210
-
211
-
212
-
213
-
214
-
215
-
216
-
217
-
218
-
219
-
220
-
221
-
222
-
223
-
224
-
225
-
226
-
227
-
228
-
229
-
230
-
231
-
232
-
233
-
234
-
235
-
236
-
237
-
238
-
239
-
240
-
241
-
242
-
243
-
244
-
245
-
246
-
247
-
248
-
249
-
250
-
251
-
252
 |
 |

69Annual Report 2015-2016
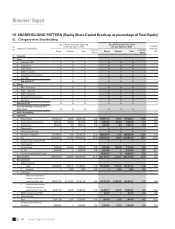
Sl
No. Category of shareholders
No. of Shares held at the beginning
of the year (April 1, 2015)
No. of Shares held at the end of
the year (March 31, 2016) % change
during the
year
Demat Physical Total % of Total
Shares Demat Physical Total % of Total
Shares
Non-Resident Indian Directors 0 0 0 –0 0 0 – –
Foreign Nationals 73,540 073,540 0.00 81,549 081,549 0.00 0.00
Non-Resident Indians 12,040,344 391,100 12,431,444 0.21 19,302,543 312,485 19,615,028 0.34 0.12
Clearing Member 8,345,722 08,345,722 0.14 14,900,585 014,900,585 0.26 0.11
Hindu Undivided Families 6,254,001 36,710 6,290,711 0.11 7,981,395 33,305 8,014,700 0.14 0.03
Foreign Companies 0143,200 143,200 0.00 0143,200 143,200 0.00 –
Foreign Bodies - DR 3,500,605 03,500,605 0.06 12,025,008 012,025,008 0.21 0.15
NRI - DR 0 0 0 –0 0 0 – –
Sub-total (B) (2) 441,799,927 31,339,470 473,139,397 8.16 514,322,545 29,675,150 543,997,695 9.36 1.19
Total Public Shareholding
(B) = (B)(1)+(B)(2) 4,080,128,725 32,562,560 4,112,691,285 70.94 4,317,700,908 30,897,740 4,348,598,648 74.79 3.84
c Shares held by Custodian for
GDRs & ADRs 1,684,553,360 01,684,553,360 29.06 1,466,169,782 01,466,169,782 25.21 (3.84)
Grand Total (A+B+C) 5,764,682,085 32,562,560 5,797,244,645 100.00 5,783,870,690 30,897,740 5,814,768,430 100.00 –
# Provident Fund/Pension Funds and NBFCs registered with RBI (reported only for March 31, 2016) are two new categories introduced
in the new shareholding format prescribed by SEBI under SEBI (Listing Obligations and Disclosure Requirements) Regulations, 2015.
Percentages have been rounded off to the nearest decimals.
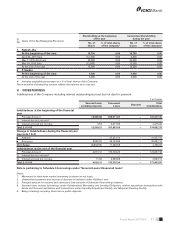
(ii) Shareholding of Promoters
N.A. – ICICI Bank Limited does not have any promoters.
(iii) Change in Promoters’ Shareholding (please specify, if there is no change)
N.A. – ICICI Bank Limited does not have any promoters.
(iv) Shareholding of top ten shareholders (other than Directors, Promoters and Holders of ADRs)
Shareholding at the beginning of the
year (April 1, 2015)
Shareholding at the end of the year
(March 31, 2016)
Top Ten Shareholders No of
shares
% of total shares
of the company
No of
shares
% of total shares
of the company
Life Insurance Corporation of India 470,276,753 8.11 598,147,787 10.29
Dodge and Cox International Stock Fund 257,911,785 4.45 322,026,107 5.54
Europacic Growth Fund 164,528,802 2.84 130,051,772 2.24
Carmignac Gestion a\c Carmignac Patrimoine 90,881,374 1.57 70,388,556 1.21
Aberdeen Global Indian Equity (Mauritius) Limited 62,100,000 1.07 58,900,000 1.01
Stichting Depository Apg Emerging Markets Equity Pool – – 50,159,097 0.86
Bajaj Holdings and Investment Ltd 50,909,085 0.88 49,392,070 0.85
Government Pension Fund Global 32,609,200 0.56 48,768,891 0.84
Government of Singapore 48,964,722 0.84 47,695,409 0.82
Vanguard Emerging Markets Stock Index fund, a series
of Vanguard International Equity Index Fund 50,820,891 0.88 43,188,899 0.74
HDFC Standard Life Insurance Company Limited 44,939,640 0.78 40,243,430 0.69
Carmignac Gestion a\c Carmignac Investissement 45,745,960 0.79 3,73,69,602 0.64
SBI Life Insurance Co Ltd 42,705,445 0.74 34,584,286 0.59
Centaura Investments (Mauritius) PTE Ltd 37,045,215 0.64 31,699,538 0.55
Merrill Lynch Capital Markets Espana S.A. S.V. 29,655,662 0.51 9,815,657 0.17
Note:
1. The above excludes shares held by Deutsche Bank Trust Company Americas in its capacity of Depositary for ADS holders. The
shares of the Bank are substantially held in dematerialised form, and are traded on a daily basis and hence the date wise increase/
decrease in shareholding is not indicated.