ICICI Bank 2016 Annual Report Download - page 232
Download and view the complete annual report
Please find page 232 of the 2016 ICICI Bank annual report below. You can navigate through the pages in the report by either clicking on the pages listed below, or by using the keyword search tool below to find specific information within the annual report.-
 1
1 -
2
-
3
-
4
-
5
-
6
-
7
-
8
-
9
-
10
-
11
-
12
-
13
-
14
-
15
-
16
-
17
-
18
-
19
-
20
-
21
-
22
-
23
-
24
-
25
-
26
-
27
-
28
-
29
-
30
-
31
-
32
-
33
-
34
-
35
-
36
-
37
-
38
-
39
-
40
-
41
-
42
-
43
-
44
-
45
-
46
-
47
-
48
-
49
-
50
-
51
-
52
-
53
-
54
-
55
-
56
-
57
-
58
-
59
-
60
-
61
-
62
-
63
-
64
-
65
-
66
-
67
-
68
-
69
-
70
-
71
-
72
-
73
-
74
-
75
-
76
-
77
-
78
-
79
-
80
-
81
-
82
-
83
-
84
-
85
-
86
-
87
-
88
-
89
-
90
-
91
-
92
-
93
-
94
-
95
-
96
-
97
-
98
-
99
-
100
-
101
-
102
-
103
-
104
-
105
-
106
-
107
-
108
-
109
-
110
-
111
-
112
-
113
-
114
-
115
-
116
-
117
-
118
-
119
-
120
-
121
-
122
-
123
-
124
-
125
-
126
-
127
-
128
-
129
-
130
-
131
-
132
-
133
-
134
-
135
-
136
-
137
-
138
-
139
-
140
-
141
-
142
-
143
-
144
-
145
-
146
-
147
-
148
-
149
-
150
-
151
-
152
-
153
-
154
-
155
-
156
-
157
-
158
-
159
-
160
-
161
-
162
-
163
-
164
-
165
-
166
-
167
-
168
-
169
-
170
-
171
-
172
-
173
-
174
-
175
-
176
-
177
-
178
-
179
-
180
-
181
-
182
-
183
-
184
-
185
-
186
-
187
-
188
-
189
-
190
-
191
-
192
-
193
-
194
-
195
-
196
-
197
-
198
-
199
-
200
-
201
-
202
-
203
-
204
-
205
-
206
-
207
-
208
-
209
-
210
-
211
-
212
-
213
-
214
-
215
-
216
-
217
-
218
-
219
-
220
-
221
-
 222
222 -
 223
223 -
 224
224 -
 225
225 -
 226
226 -
 227
227 -
 228
228 -
 229
229 -
 230
230 -
 231
231 -
 232
232 -
 233
233 -
 234
234 -
 235
235 -
 236
236 -
 237
237 -
 238
238 -
 239
239 -
 240
240 -
 241
241 -
 242
242 -
243
-
244
-
245
-
246
-
247
-
248
-
249
-
250
-
251
-
252
 |
 |

Annual Report 2015-2016230
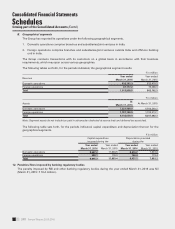
Schedules
forming part of the Consolidated Accounts (Contd.)
Consolidated Financial Statements
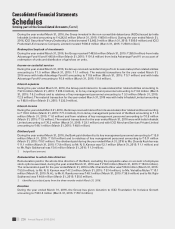
ICICI General:
ICICI Lombard General Insurance Company has formulated ESOS for their employees. There is no compensation
cost for the year ended March 31, 2016 based on the intrinsic value of options. If the entity had used the fair value
approach for accounting of options compensation cost for the year ended March 31, 2016 would have been higher
by Nil (March 31, 2015: ` 4.5 million).
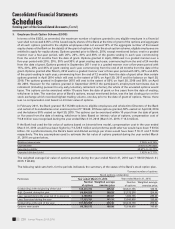
The following table sets forth, for the periods indicated, a summary of the status of the stock option plan of ICICI
Lombard General Insurance Company.
` except number of options
Particulars
Stock options outstanding
Year ended March 31, 2016 Year ended March 31, 2015
Number
of shares
Weighted average
exercise price
Number
of shares
Weighted average
exercise price
Outstanding at the beginning of the year 8,121,462 109.32 9,844,494 105.39
Add: Granted during the year – – – –
Less: Forfeited/ lapsed during the year 200,200 148.9 254,516 116.10
Less : Exercised during the year 917,014 67.12 1,468,516 81.82
Outstanding at the end of the year 7,004,248 113.71 8,121,462 109.32
Options exercisable 7,004,248 113.71 8,121,462 109.32
The following table sets forth, summary of stock options outstanding of ICICI Lombard General Insurance Company
at March 31, 2016.
Range of exercise price
(` per share)
Number of shares
arising out of options
(number of shares)
Weighted average exercise
price
(` per share)
Weighted average
remaining contractual life
(number of years)
35-99 3,251,898 57.23 3.50
100-200 3,752,350 162.66 3.03
If the Group had used the fair value of options based on the binomial tree model, the compensation cost for the
year ended March 31, 2016 would have been higher by ` 3,585.0 million (March 31, 2015: ` 2,761.1 million) and
the proforma consolidated prot after tax would have been ` 98.21 billion (March 31, 2015: ` 119.71 billion). On a
proforma basis, the Group’s basic earnings per share would have been ` 16.91 (March 31, 2015: ` 20.69) and diluted
earnings per share would have been ` 16.80 (March 31, 2015: ` 20.47).
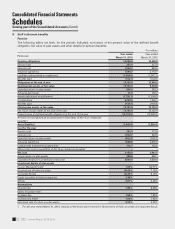
4. Fixed assets
The following table sets forth, for the periods indicated, the movement in software acquired by the Group, as included
in xed assets.
` in million
Particulars At
March 31, 2016
At
March 31, 2015
At cost at March 31 of preceding year 15,735.1 13,525.0
Additions during the year 2,507.7 2,439.1
Deductions during the year (439.6) (229.0)
Depreciation to date (13,615.4) (11,876.8)
Net block 4,187.8 3,858.3