ICICI Bank 2016 Annual Report Download - page 98
Download and view the complete annual report
Please find page 98 of the 2016 ICICI Bank annual report below. You can navigate through the pages in the report by either clicking on the pages listed below, or by using the keyword search tool below to find specific information within the annual report.-
 1
1 -
2
-
3
-
4
-
5
-
6
-
7
-
8
-
9
-
10
-
11
-
12
-
13
-
14
-
15
-
16
-
17
-
18
-
19
-
20
-
21
-
22
-
23
-
24
-
25
-
26
-
27
-
28
-
29
-
30
-
31
-
32
-
33
-
34
-
35
-
36
-
37
-
38
-
39
-
40
-
41
-
42
-
43
-
44
-
45
-
46
-
47
-
48
-
49
-
50
-
51
-
52
-
53
-
54
-
55
-
56
-
57
-
58
-
59
-
60
-
61
-
62
-
63
-
64
-
65
-
66
-
67
-
68
-
69
-
70
-
71
-
72
-
73
-
74
-
75
-
76
-
77
-
78
-
79
-
80
-
81
-
82
-
83
-
84
-
85
-
86
-
87
-
 88
88 -
 89
89 -
 90
90 -
 91
91 -
 92
92 -
 93
93 -
 94
94 -
 95
95 -
 96
96 -
 97
97 -
 98
98 -
 99
99 -
 100
100 -
 101
101 -
 102
102 -
 103
103 -
 104
104 -
 105
105 -
 106
106 -
 107
107 -
 108
108 -
109
-
110
-
111
-
112
-
113
-
114
-
115
-
116
-
117
-
118
-
119
-
120
-
121
-
122
-
123
-
124
-
125
-
126
-
127
-
128
-
129
-
130
-
131
-
132
-
133
-
134
-
135
-
136
-
137
-
138
-
139
-
140
-
141
-
142
-
143
-
144
-
145
-
146
-
147
-
148
-
149
-
150
-
151
-
152
-
153
-
154
-
155
-
156
-
157
-
158
-
159
-
160
-
161
-
162
-
163
-
164
-
165
-
166
-
167
-
168
-
169
-
170
-
171
-
172
-
173
-
174
-
175
-
176
-
177
-
178
-
179
-
180
-
181
-
182
-
183
-
184
-
185
-
186
-
187
-
188
-
189
-
190
-
191
-
192
-
193
-
194
-
195
-
196
-
197
-
198
-
199
-
200
-
201
-
202
-
203
-
204
-
205
-
206
-
207
-
208
-
209
-
210
-
211
-
212
-
213
-
214
-
215
-
216
-
217
-
218
-
219
-
220
-
221
-
222
-
223
-
224
-
225
-
226
-
227
-
228
-
229
-
230
-
231
-
232
-
233
-
234
-
235
-
236
-
237
-
238
-
239
-
240
-
241
-
242
-
243
-
244
-
245
-
246
-
247
-
248
-
249
-
250
-
251
-
252
 |
 |

96
Management’s Discussion & Analysis
Annual Report 2015-2016
Provisions and contingencies (excluding collective contingency and related reserve and provision for tax) increased by
` 41.68 billion from ` 39.00 billion in scal 2015 to ` 80.67 billion in scal 2016. This increase was primarily due to an
increase in provisions on non-performing assets. The net NPA ratio increased from 1.40% at March 31, 2015 to 2.67% at
March 31, 2016. Provisions for non-performing assets are likely to remain elevated in the near term.
The weak global economic environment, the sharp downturn in the commodity cycle and the gradual nature of the
domestic economic recovery has adversely impacted the borrowers in certain sectors such as iron and steel, mining,
power, rigs and cement. While the banks are working towards resolution of stress on certain borrowers in these sectors,
it may take some time for solutions to be worked out, given the weak operating and recovery environment. In view of the
above, the Bank, on a prudent basis, has created a collective contingency and related reserve of ` 36.00 billion towards
its exposures to these sectors.
The income tax expense (including wealth tax) decreased by 46.8% from ` 46.45 billion in scal 2015 to ` 24.70 billion in
scal 2016 primarily due to lower applicable tax on sale of equity investments and set-off of carry forward capital losses
pertaining to earlier periods.
The prot after tax decreased by 13.0% from ` 111.75 billion in scal 2015 to ` 97.26 billion in scal 2016.
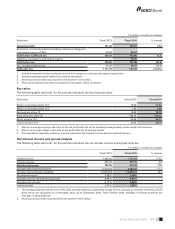
Net-worth increased from ` 804.29 billion at March 31, 2015 to ` 897.36 billion at March 31, 2016 primarily due to accretion
to reserves from prot for the year and creation of revaluation reserves on xed assets. Total assets increased by 11.5%
from ` 6,461.29 billion at March 31, 2015 to ` 7,206.95 billion at March 31, 2016. Total deposits increased by 16.6% from
` 3,615.63 billion at March 31, 2015 to ` 4,214.26 billion at March 31, 2016. Savings account deposits increased by 16.9%
from ` 1,148.60 billion at March 31, 2015 to ` 1,342.30 billion at March 31, 2016. Current account deposits increased
by 18.9% from ` 495.20 billion at March 31, 2015 to ` 588.70 billion at March 31, 2016. Term deposits increased by
15.8% from ` 1,971.83 billion at March 31, 2015 to ` 2,283.26 billion at March 31, 2016. The current and savings account
(CASA) ratio was 45.8% at March 31, 2016 compared to 45.5% at March 31, 2015. Total advances increased by 12.3%
from ` 3,875.22 billion at March 31, 2015 to ` 4,352.64 billion at March 31, 2016 primarily due to an increase in domestic
advances. Retail advances increased by 23.3% from ` 1,644.41 billion at March 31, 2015 to ` 2,027.90 billion at March
31, 2016.
The Bank continued to expand its branch network in India. The branch network of the Bank in India increased from 4,050
branches at March 31, 2015 to 4,450 branches at March 31, 2016. The ATM network of the Bank increased from 12,451
ATMs at March 31, 2015 to 13,766 ATMs at March 31, 2016.
The Bank is subject to the Basel III capital adequacy guidelines stipulated by RBI. The total capital adequacy ratio of the
Bank at March 31, 2016 in accordance with RBI guidelines on Basel III was 16.64% with a Tier-1 capital adequacy ratio of
13.09% as compared to 17.02% with a Tier-1 capital adequacy ratio of 12.78% at March 31, 2015.
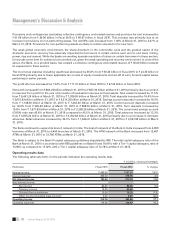
Operating results data
The following table sets forth, for the periods indicated, the operating results data.
` in billion, except percentages
Particulars Fiscal 2015 Fiscal 2016 % change
Interest income ` 490.92 ` 527.39 7.4%
Interest expense 300.52 315.15 4.9
Net interest income 190.40 212.24 11.5
Non-interest income
- Fee income1 82.87 88.20 6.4
- Treasury income 16.93 40.60 –
- Dividend from subsidiaries 15.59 15.35 (1.5)
- Other income (including lease income)2 6.37 9.07 42.4
Operating income 312.16 365.46 17.1
Operating expenses 114.96 126.83 10.3