ICICI Bank 2016 Annual Report Download - page 178
Download and view the complete annual report
Please find page 178 of the 2016 ICICI Bank annual report below. You can navigate through the pages in the report by either clicking on the pages listed below, or by using the keyword search tool below to find specific information within the annual report.-
 1
1 -
2
-
3
-
4
-
5
-
6
-
7
-
8
-
9
-
10
-
11
-
12
-
13
-
14
-
15
-
16
-
17
-
18
-
19
-
20
-
21
-
22
-
23
-
24
-
25
-
26
-
27
-
28
-
29
-
30
-
31
-
32
-
33
-
34
-
35
-
36
-
37
-
38
-
39
-
40
-
41
-
42
-
43
-
44
-
45
-
46
-
47
-
48
-
49
-
50
-
51
-
52
-
53
-
54
-
55
-
56
-
57
-
58
-
59
-
60
-
61
-
62
-
63
-
64
-
65
-
66
-
67
-
68
-
69
-
70
-
71
-
72
-
73
-
74
-
75
-
76
-
77
-
78
-
79
-
80
-
81
-
82
-
83
-
84
-
85
-
86
-
87
-
88
-
89
-
90
-
91
-
92
-
93
-
94
-
95
-
96
-
97
-
98
-
99
-
100
-
101
-
102
-
103
-
104
-
105
-
106
-
107
-
108
-
109
-
110
-
111
-
112
-
113
-
114
-
115
-
116
-
117
-
118
-
119
-
120
-
121
-
122
-
123
-
124
-
125
-
126
-
127
-
128
-
129
-
130
-
131
-
132
-
133
-
134
-
135
-
136
-
137
-
138
-
139
-
140
-
141
-
142
-
143
-
144
-
145
-
146
-
147
-
148
-
149
-
150
-
151
-
152
-
153
-
154
-
155
-
156
-
157
-
158
-
159
-
160
-
161
-
162
-
163
-
164
-
165
-
166
-
167
-
 168
168 -
 169
169 -
 170
170 -
 171
171 -
 172
172 -
 173
173 -
 174
174 -
 175
175 -
 176
176 -
 177
177 -
 178
178 -
 179
179 -
 180
180 -
 181
181 -
 182
182 -
 183
183 -
 184
184 -
 185
185 -
 186
186 -
 187
187 -
 188
188 -
189
-
190
-
191
-
192
-
193
-
194
-
195
-
196
-
197
-
198
-
199
-
200
-
201
-
202
-
203
-
204
-
205
-
206
-
207
-
208
-
209
-
210
-
211
-
212
-
213
-
214
-
215
-
216
-
217
-
218
-
219
-
220
-
221
-
222
-
223
-
224
-
225
-
226
-
227
-
228
-
229
-
230
-
231
-
232
-
233
-
234
-
235
-
236
-
237
-
238
-
239
-
240
-
241
-
242
-
243
-
244
-
245
-
246
-
247
-
248
-
249
-
250
-
251
-
252
 |
 |

Annual Report 2015-2016176
Schedules
forming part of the Accounts (Contd.)
Financial Statements of ICICI Bank Limited
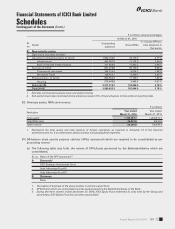
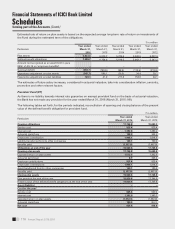
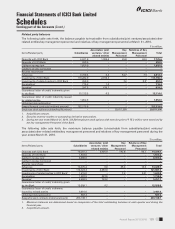
Estimated rate of return on plan assets is based on the expected average long-term rate of return on investments of
the Fund during the estimated term of the obligations.
` in million
Particulars
Year ended
March 31,
2016
Year ended
March 31,
2015
Year ended
March 31,
2014
Year ended
March 31,
2013
Year ended
March 31,
2012
Plan assets 6,933.0 6,570.7 5,729.9 5,530.5 5,027.4
Dened benet obligations 7,386.7 6,754.6 5,818.5 5,643.1 5,247.2
Amount not recognised as an asset (limit in para
59(b) of AS-15 on ‘employee benets’) – – – – –
Surplus/(decit) (453.7) (183.9) (88.6) (112.6) (219.8)
Experience adjustment on plan assets (345.7) 589.1 (29.5) 34.4 20.1
Experience adjustment on plan liabilities 120.1 41.9 217.6 153.6 44.1
The estimates of future salary increases, considered in actuarial valuation, take into consideration ination, seniority,
promotion and other relevant factors.
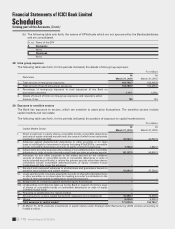
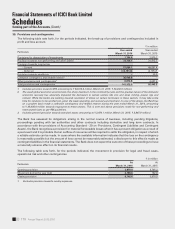
Provident Fund (PF)
As there is no liability towards interest rate guarantee on exempt provident fund on the basis of actuarial valuation,
the Bank has not made any provision for the year ended March 31, 2016 (March 31, 2015: Nil).
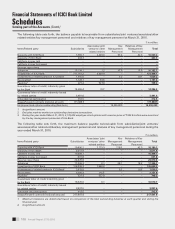
The following tables set forth, for the periods indicated, reconciliation of opening and closing balance of the present
value of the dened benet obligation for provident fund.
` in million
Particulars Year ended
March 31, 2016
Year ended
March 31, 2015
Opening obligations 17,746.8 15,693.3
Service cost 925.4 920.4
Interest cost 1,382.0 1,383.2
Actuarial (gain)/loss 199.0 322.3
Employees contribution 1,905.1 1,814.6
Liability transferred from/to other companies 120.1 100.9
Benets paid (2,357.8) (2,487.9)
Obligations at end of the year 19,920.6 17,746.8
Opening plan assets 17,746.8 15,689.8
Expected return on plan assets 1,572.3 1,362.6
Actuarial gain/(loss) 8.7 346.4
Employer contributions 925.4 920.4
Employees contributions 1,905.1 1,814.6
Asset transferred from/to other companies 120.1 100.9
Benets paid (2,357.8) (2,487.9)
Closing plan assets 19,920.6 17,746.8
Plan assets at the end of the year 19,920.6 17,746.8
Present value of the dened benet obligations at the end of the year 19,920.6 17,746.8
Asset/(liability) – –
Cost for the year1
Service cost 925.4 920.4
Interest cost 1,382.0 1,383.2
Expected return on plan assets (1,572.3) (1,362.6)
Actuarial (gain)/loss 190.3 (24.1)
Net cost 925.4 916.9