ICICI Bank 2016 Annual Report Download - page 133
Download and view the complete annual report
Please find page 133 of the 2016 ICICI Bank annual report below. You can navigate through the pages in the report by either clicking on the pages listed below, or by using the keyword search tool below to find specific information within the annual report.-
 1
1 -
2
-
3
-
4
-
5
-
6
-
7
-
8
-
9
-
10
-
11
-
12
-
13
-
14
-
15
-
16
-
17
-
18
-
19
-
20
-
21
-
22
-
23
-
24
-
25
-
26
-
27
-
28
-
29
-
30
-
31
-
32
-
33
-
34
-
35
-
36
-
37
-
38
-
39
-
40
-
41
-
42
-
43
-
44
-
45
-
46
-
47
-
48
-
49
-
50
-
51
-
52
-
53
-
54
-
55
-
56
-
57
-
58
-
59
-
60
-
61
-
62
-
63
-
64
-
65
-
66
-
67
-
68
-
69
-
70
-
71
-
72
-
73
-
74
-
75
-
76
-
77
-
78
-
79
-
80
-
81
-
82
-
83
-
84
-
85
-
86
-
87
-
88
-
89
-
90
-
91
-
92
-
93
-
94
-
95
-
96
-
97
-
98
-
99
-
100
-
101
-
102
-
103
-
104
-
105
-
106
-
107
-
108
-
109
-
110
-
111
-
112
-
113
-
114
-
115
-
116
-
117
-
118
-
119
-
120
-
121
-
122
-
 123
123 -
 124
124 -
 125
125 -
 126
126 -
 127
127 -
 128
128 -
 129
129 -
 130
130 -
 131
131 -
 132
132 -
 133
133 -
 134
134 -
 135
135 -
 136
136 -
 137
137 -
 138
138 -
 139
139 -
 140
140 -
 141
141 -
 142
142 -
 143
143 -
144
-
145
-
146
-
147
-
148
-
149
-
150
-
151
-
152
-
153
-
154
-
155
-
156
-
157
-
158
-
159
-
160
-
161
-
162
-
163
-
164
-
165
-
166
-
167
-
168
-
169
-
170
-
171
-
172
-
173
-
174
-
175
-
176
-
177
-
178
-
179
-
180
-
181
-
182
-
183
-
184
-
185
-
186
-
187
-
188
-
189
-
190
-
191
-
192
-
193
-
194
-
195
-
196
-
197
-
198
-
199
-
200
-
201
-
202
-
203
-
204
-
205
-
206
-
207
-
208
-
209
-
210
-
211
-
212
-
213
-
214
-
215
-
216
-
217
-
218
-
219
-
220
-
221
-
222
-
223
-
224
-
225
-
226
-
227
-
228
-
229
-
230
-
231
-
232
-
233
-
234
-
235
-
236
-
237
-
238
-
239
-
240
-
241
-
242
-
243
-
244
-
245
-
246
-
247
-
248
-
249
-
250
-
251
-
252
 |
 |

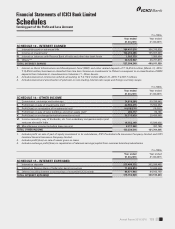
Annual Report 2015-2016 131
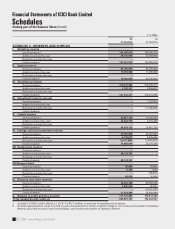
Schedules
forming part of the Balance Sheet (Contd.)
Financial Statements of ICICI Bank Limited
` in ‘000s
At
31.03.2016
At
31.03.2015
SCHEDULE 9 - ADVANCES [NET OF PROVISIONS]
A. i) Bills purchased and discounted 125,883,999 124,699,264
ii) Cash credits, overdrafts and loans repayable on demand 845,132,942 678,157,310
iii) Term loans 3,381,622,478 3,072,364,154
TOTAL ADVANCES 4,352,639,419 3,875,220,728
B. i) Secured by tangible assets (includes advances against book debts) 3,508,024,917 3,246,003,157
ii) Covered by bank/government guarantees 91,968,107 96,877,890
iii) Unsecured 752,646,395 532,339,681
TOTAL ADVANCES 4,352,639,419 3,875,220,728
C. I. Advances in India
i) Priority sector 924,348,694 762,092,862
ii) Public sector 44,329,100 35,374,080
iii) Banks 283,403 146,618
iv) Others 2,445,558,803 2,136,406,625
TOTAL ADVANCES IN INDIA 3,414,520,000 2,934,020,185
II. Advances outside India
i) Due from banks 4,860,662 2,483,044
ii) Due from others
a) Bills purchased and discounted 37,850,081 44,434,806
b) Syndicated and term loans 737,769,046 765,973,178
c) Others 157,639,630 128,309,515
TOTAL ADVANCES OUTSIDE INDIA 938,119,419 941,200,543
TOTAL ADVANCES 4,352,639,419 3,875,220,728
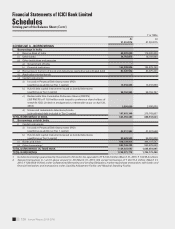
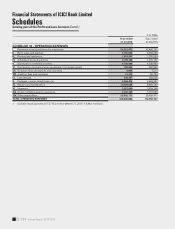
` in ‘000s
At
31.03.2016
At
31.03.2015
SCHEDULE 10 - FIXED ASSETS
I. Premises
At cost at March 31 of preceding year 40,522,620 39,639,238
Additions during the year1 29,414,022 1,095,947
Deductions during the year (600,593) (212,565)
Depreciation to date2 (10,859,345) (9,896,951)
Net block3 58,476,704 30,625,669
II. Other xed assets (including furniture and xtures)
At cost at March 31 of preceding year 46,222,026 42,567,275
Additions during the year 6,217,940 6,173,584
Deductions during the year (2,306,918) (2,518,833)
Depreciation to date4 (35,255,187) (31,918,804)
Net block 14,877,861 14,303,222
III. Assets given on lease
At cost at March 31 of preceding year 17,299,544 17,299,544
Additions during the year ––
Deductions during the year ––
Depreciation to date, accumulated lease adjustment and provisions5 (14,884,909) (14,973,248)
Net block 2,414,635 2,326,296
TOTAL FIXED ASSETS 75,769,200 47,255,187
1. Includes ` 28,174.7 million added on revaluation carried out by the Bank on March 31, 2016.
2. Includes depreciation charge amounting to ` 1,291.2 million (March 31, 2015: ` 1,270.2 million).
3. Includes assets of ` 13.6 million (March 31, 2015: ` 2.0 million) which are held for sale.