ICICI Bank 2016 Annual Report Download - page 70
Download and view the complete annual report
Please find page 70 of the 2016 ICICI Bank annual report below. You can navigate through the pages in the report by either clicking on the pages listed below, or by using the keyword search tool below to find specific information within the annual report.-
 1
1 -
2
-
3
-
4
-
5
-
6
-
7
-
8
-
9
-
10
-
11
-
12
-
13
-
14
-
15
-
16
-
17
-
18
-
19
-
20
-
21
-
22
-
23
-
24
-
25
-
26
-
27
-
28
-
29
-
30
-
31
-
32
-
33
-
34
-
35
-
36
-
37
-
38
-
39
-
40
-
41
-
42
-
43
-
44
-
45
-
46
-
47
-
48
-
49
-
50
-
51
-
52
-
53
-
54
-
55
-
56
-
57
-
58
-
59
-
 60
60 -
 61
61 -
 62
62 -
 63
63 -
 64
64 -
 65
65 -
 66
66 -
 67
67 -
 68
68 -
 69
69 -
 70
70 -
 71
71 -
 72
72 -
 73
73 -
 74
74 -
 75
75 -
 76
76 -
 77
77 -
 78
78 -
 79
79 -
 80
80 -
81
-
82
-
83
-
84
-
85
-
86
-
87
-
88
-
89
-
90
-
91
-
92
-
93
-
94
-
95
-
96
-
97
-
98
-
99
-
100
-
101
-
102
-
103
-
104
-
105
-
106
-
107
-
108
-
109
-
110
-
111
-
112
-
113
-
114
-
115
-
116
-
117
-
118
-
119
-
120
-
121
-
122
-
123
-
124
-
125
-
126
-
127
-
128
-
129
-
130
-
131
-
132
-
133
-
134
-
135
-
136
-
137
-
138
-
139
-
140
-
141
-
142
-
143
-
144
-
145
-
146
-
147
-
148
-
149
-
150
-
151
-
152
-
153
-
154
-
155
-
156
-
157
-
158
-
159
-
160
-
161
-
162
-
163
-
164
-
165
-
166
-
167
-
168
-
169
-
170
-
171
-
172
-
173
-
174
-
175
-
176
-
177
-
178
-
179
-
180
-
181
-
182
-
183
-
184
-
185
-
186
-
187
-
188
-
189
-
190
-
191
-
192
-
193
-
194
-
195
-
196
-
197
-
198
-
199
-
200
-
201
-
202
-
203
-
204
-
205
-
206
-
207
-
208
-
209
-
210
-
211
-
212
-
213
-
214
-
215
-
216
-
217
-
218
-
219
-
220
-
221
-
222
-
223
-
224
-
225
-
226
-
227
-
228
-
229
-
230
-
231
-
232
-
233
-
234
-
235
-
236
-
237
-
238
-
239
-
240
-
241
-
242
-
243
-
244
-
245
-
246
-
247
-
248
-
249
-
250
-
251
-
252
 |
 |

68
Directors’ Report
Annual Report 2015-2016
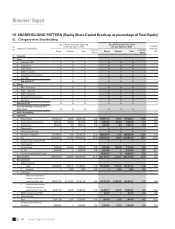
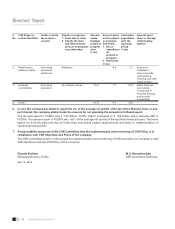
IV. SHAREHOLDING PATTERN (Equity Share Capital Break-up as percentage of Total Equity)
(i) Category-wise Shareholding
Sl
No. Category of shareholders
No. of Shares held at the beginning
of the year (April 1, 2015)
No. of Shares held at the end of
the year (March 31, 2016) % change
during the
year
Demat Physical Total % of Total
Shares Demat Physical Total % of Total
Shares
A Promoters
(1) Indian
a) Individual / HUF 0 0 0 –0 0 0 – –
b) Central Govt 0 0 0 –0 0 0 – –
c) State Govt(s) 0 0 0 –0 0 0 – –
d) Bodies Corporate 0 0 0 –0 0 0 – –
e) Banks/Financial Institutions 0 0 0 –0 0 0 – –
f) Any Other 0 0 0 –0 0 0 – –
Sub-total (A) (1) 0 0 0 – 0 0 0 – –
(2) Foreign
a) NRIs - Individuals 0 0 0 –0 0 0 – –
b) Other - Individuals 0 0 0 –0 0 0 – –
c) Bodies Corporate 0 0 0 –0 0 0 – –
d) Banks/Financial Institutions 0 0 0 –0 0 0 – –
e) Any Other 0 0 0 –0 0 0 – –
Sub-total (A) (2) 0 0 0 – 0 0 0 – –
Total Shareholding of Promoter (A) =
(A)(1)+(A)(2) 0 0 0 – 0 0 0 – –
B Public Shareholding
(1) Institutions
a) Mutual Funds 477,932,370 69,260 478,001,630 8.25 619,557,411 69,260 619,626,671 10.66 2.41
b) Banks /Financial Institutions 3,401,295 109,200 3,510,495 0.06 6,097,586 109,200 6,206,786 0.11 0.05
c) Central Govt 3,624,764 390 3,625,154 0.06 7,989,386 390 7,989,776 0.14 0.07
d) State Govt(s) 0 0 0 –0 0 0 – –
e) Venture Capital Funds 0 0 0 –0 0 0 – –
f) Insurance Companies 772,186,079 1,100 772,187,179 13.32 888,934,854 1,100 888,935,954 15.29 1.97
g) FIIs 2,375,508,640 117,300 2,375,625,940 40.98 2,256,765,038 116,800 2,256,881,838 38.81 (2.17)
h) Foreign Venture Capital Funds 0 0 0 –0 0 0 – –
i) Other (specify)
Foreign Banks 1,065,825 925,840 1,991,665 0.03 1,247,465 925,840 2,173,305 0.04 0.00
FII - DR 4,609,825 04,609,825 0.08 4,224,966 04,224,966 0.07 (0.01)
j) Provident Funds/Pension Funds
#
– – – – 18,561,657 018,561,657 0.32 0.32
Sub-total (B) (1) 3,638,328,798 1,223,090 3,639,551,888 62.78 3,803,378,363 1,222,590 3,804,600,953 65.43 2.65
(2) Non-Institutions
a Bodies Corporate
i Indian 125,663,508 1,422,515 127,086,023 2.19 142,762,650 1,375,025 144,137,675 2.48 0.29
ii Overseas 03,000 3,000 0.00 03,000 3,000 0.00 –
bIndividuals
i Individual shareholders
holding nominal share
capital upto Rs.1 lakh 232,753,765 29,197,395 261,951,160 4.52 273,077,696 27,585,585 300,663,281 5.17 0.65
ii Individual shareholders
holding nominal share
capital excess of Rs.1 lakh 36,601,690 144,475 36,746,165 0.63 39,455,517 144,475 39,599,992 0.68 0.05
c NBFCs registered with RBI
#
– – – – 180,043 0180,043 0.00 0.00
d Others (specify)
Trust 13,012,726 1,075 13,013,801 0.22 979,094 1,075 980,169 0.02 (0.21)
Directors & their Relatives
(Resident) 3,554,026 03,554,026 0.06 3,576,465 77,000 3,653,465 0.06 0.00