ICICI Bank 2016 Annual Report Download - page 155
Download and view the complete annual report
Please find page 155 of the 2016 ICICI Bank annual report below. You can navigate through the pages in the report by either clicking on the pages listed below, or by using the keyword search tool below to find specific information within the annual report.-
 1
1 -
2
-
3
-
4
-
5
-
6
-
7
-
8
-
9
-
10
-
11
-
12
-
13
-
14
-
15
-
16
-
17
-
18
-
19
-
20
-
21
-
22
-
23
-
24
-
25
-
26
-
27
-
28
-
29
-
30
-
31
-
32
-
33
-
34
-
35
-
36
-
37
-
38
-
39
-
40
-
41
-
42
-
43
-
44
-
45
-
46
-
47
-
48
-
49
-
50
-
51
-
52
-
53
-
54
-
55
-
56
-
57
-
58
-
59
-
60
-
61
-
62
-
63
-
64
-
65
-
66
-
67
-
68
-
69
-
70
-
71
-
72
-
73
-
74
-
75
-
76
-
77
-
78
-
79
-
80
-
81
-
82
-
83
-
84
-
85
-
86
-
87
-
88
-
89
-
90
-
91
-
92
-
93
-
94
-
95
-
96
-
97
-
98
-
99
-
100
-
101
-
102
-
103
-
104
-
105
-
106
-
107
-
108
-
109
-
110
-
111
-
112
-
113
-
114
-
115
-
116
-
117
-
118
-
119
-
120
-
121
-
122
-
123
-
124
-
125
-
126
-
127
-
128
-
129
-
130
-
131
-
132
-
133
-
134
-
135
-
136
-
137
-
138
-
139
-
140
-
141
-
142
-
143
-
144
-
 145
145 -
 146
146 -
 147
147 -
 148
148 -
 149
149 -
 150
150 -
 151
151 -
 152
152 -
 153
153 -
 154
154 -
 155
155 -
 156
156 -
 157
157 -
 158
158 -
 159
159 -
 160
160 -
 161
161 -
 162
162 -
 163
163 -
 164
164 -
 165
165 -
166
-
167
-
168
-
169
-
170
-
171
-
172
-
173
-
174
-
175
-
176
-
177
-
178
-
179
-
180
-
181
-
182
-
183
-
184
-
185
-
186
-
187
-
188
-
189
-
190
-
191
-
192
-
193
-
194
-
195
-
196
-
197
-
198
-
199
-
200
-
201
-
202
-
203
-
204
-
205
-
206
-
207
-
208
-
209
-
210
-
211
-
212
-
213
-
214
-
215
-
216
-
217
-
218
-
219
-
220
-
221
-
222
-
223
-
224
-
225
-
226
-
227
-
228
-
229
-
230
-
231
-
232
-
233
-
234
-
235
-
236
-
237
-
238
-
239
-
240
-
241
-
242
-
243
-
244
-
245
-
246
-
247
-
248
-
249
-
250
-
251
-
252
 |
 |

Annual Report 2015-2016 153
Schedules
forming part of the Accounts (Contd.)
Financial Statements of ICICI Bank Limited
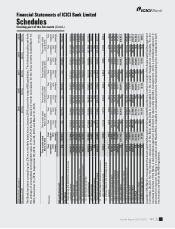
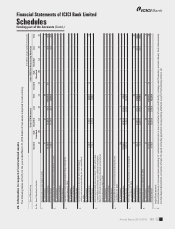
The following table sets forth, the issuer composition of investments of the Bank in securities, other than
government and other approved securities at March 31, 2015.
` in million
Sr.
No.
Issuer Amount
Extent of
private
placement2
Extent of ‘below
investment grade’
securities
Extent of
‘unrated’
securities 3,4
Extent of
‘unlisted’
securities4
(a) (b) (c) (d)
1PSUs 16,011.7 10,870.8 – – –
2 FIs 37,028.6 25,340.3 – – –
3 Banks 121,737.0 107,104.2 – – –
4 Private corporates 97,754.7 88,835.8 7,836.4 4,054.6 3,032.8
5 Subsidiaries/ Joint ventures 117,751.2 – – – 6,861.9
6 Others5,6,7 142,751.0 141,016.6 16,888.7 – –
7Provision held towards depreciation (25,674.7) N.A N.A N.A N.A
Total 507,359.5 373,167.7 24,725.1 4,054.6 9,894.7
1. Amounts reported under columns (a), (b), (c) and (d) above are not mutually exclusive.
2. Includes ` 33,050.4 million of application money towards corporate bonds/debentures and pass through certificates.
3. Excludes investments, amounting to ` 4,396.9 million in preference shares of subsidiaries and ` 2,465.0 million in
subordinated bonds of subsidiary ICICI Bank Canada.
4. Excludes equity shares, units of equity-oriented mutual fund, units of venture capital fund, pass through certificates,
security receipts, commercial papers, certificates of deposit, non-convertible debentures (NCDs) with original or initial
maturity up to one year issued by corporate (including NBFCs), unlisted convertible debentures and securities acquired
by way of conversion of debt.
5. Excludes investments in non-Indian government securities by overseas branches amounting to ` 17,824.0 million.
6. Excludes investments in non-SLR Indian government securities amounting to ` 90.8 million.
7. Pursuant to RBI guidelines, investment in Rural Infrastructure and Development Fund and other related deposits of
` 284,508.2 million has been re-classified to line item ‘Others’ under Schedule 11 - Other Assets.
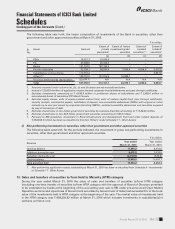
ii) Non-performing investments in securities, other than government and other approved securities
The following table sets forth, for the periods indicated, the movement in gross non-performing investments in
securities, other than government and other approved securities.
` in million
Revenue Year ended
March 31, 2016
Year ended
March 31, 2015
Opening balance 11,444.2 4,414.0
Additions during the year 8,075.2 7,633.5
Reduction during the year (2,718.9) (549.8)
Closing balance 16,800.5 11,497.7
Total provision held 10,404.2 8,262.2
1. Non-performing application money outstanding at March 31, 2015 has been re-classified from Schedule 8 - Investments
to Schedule 11 - Other Assets.
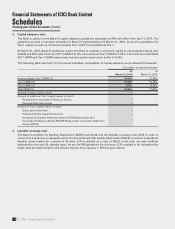
13. Sales and transfers of securities to/from Held to Maturity (HTM) category
During the year ended March 31, 2016 the value of sales and transfers of securities to/from HTM category
(excluding one-time transfer of securities to/from HTM category with the approval of Board of Directors permitted
to be undertaken by banks at the beginning of the accounting year, sale to RBI under pre-announced Open Market
Operation auctions and repurchase of Government securities by Government of India) had exceeded 5% of the book
value of the investments held in HTM category at the beginning of the year. The market value of investments held
in the HTM category was ` 999,326.82 million at March 31, 2016 which includes investments in subsidiaries/joint
ventures carried at cost.