ICICI Bank 2016 Annual Report Download - page 109
Download and view the complete annual report
Please find page 109 of the 2016 ICICI Bank annual report below. You can navigate through the pages in the report by either clicking on the pages listed below, or by using the keyword search tool below to find specific information within the annual report.-
 1
1 -
2
-
3
-
4
-
5
-
6
-
7
-
8
-
9
-
10
-
11
-
12
-
13
-
14
-
15
-
16
-
17
-
18
-
19
-
20
-
21
-
22
-
23
-
24
-
25
-
26
-
27
-
28
-
29
-
30
-
31
-
32
-
33
-
34
-
35
-
36
-
37
-
38
-
39
-
40
-
41
-
42
-
43
-
44
-
45
-
46
-
47
-
48
-
49
-
50
-
51
-
52
-
53
-
54
-
55
-
56
-
57
-
58
-
59
-
60
-
61
-
62
-
63
-
64
-
65
-
66
-
67
-
68
-
69
-
70
-
71
-
72
-
73
-
74
-
75
-
76
-
77
-
78
-
79
-
80
-
81
-
82
-
83
-
84
-
85
-
86
-
87
-
88
-
89
-
90
-
91
-
92
-
93
-
94
-
95
-
96
-
97
-
98
-
 99
99 -
 100
100 -
 101
101 -
 102
102 -
 103
103 -
 104
104 -
 105
105 -
 106
106 -
 107
107 -
 108
108 -
 109
109 -
 110
110 -
 111
111 -
 112
112 -
 113
113 -
 114
114 -
 115
115 -
 116
116 -
 117
117 -
 118
118 -
 119
119 -
120
-
121
-
122
-
123
-
124
-
125
-
126
-
127
-
128
-
129
-
130
-
131
-
132
-
133
-
134
-
135
-
136
-
137
-
138
-
139
-
140
-
141
-
142
-
143
-
144
-
145
-
146
-
147
-
148
-
149
-
150
-
151
-
152
-
153
-
154
-
155
-
156
-
157
-
158
-
159
-
160
-
161
-
162
-
163
-
164
-
165
-
166
-
167
-
168
-
169
-
170
-
171
-
172
-
173
-
174
-
175
-
176
-
177
-
178
-
179
-
180
-
181
-
182
-
183
-
184
-
185
-
186
-
187
-
188
-
189
-
190
-
191
-
192
-
193
-
194
-
195
-
196
-
197
-
198
-
199
-
200
-
201
-
202
-
203
-
204
-
205
-
206
-
207
-
208
-
209
-
210
-
211
-
212
-
213
-
214
-
215
-
216
-
217
-
218
-
219
-
220
-
221
-
222
-
223
-
224
-
225
-
226
-
227
-
228
-
229
-
230
-
231
-
232
-
233
-
234
-
235
-
236
-
237
-
238
-
239
-
240
-
241
-
242
-
243
-
244
-
245
-
246
-
247
-
248
-
249
-
250
-
251
-
252
 |
 |

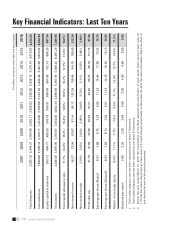
107Annual Report 2015-2016
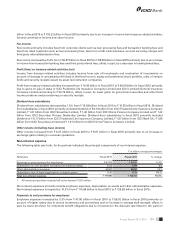
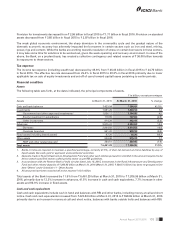
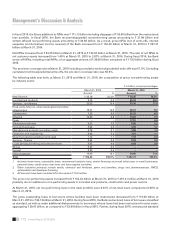
` in billion, except percentages
Basel III At
March 31, 2015
At
March 31, 2016
CET1 capital 696.61 789.59
Tier-1 capital 696.61 794.82
Tier-2 capital 230.83 215.13
Total capital 927.44 1,009.95
Credit Risk — RWA 4,741.56 5,263.19
On balance sheet 3,678.25 4,213.23
Off balance sheet 1,063.31 1,049.96
Market Risk — RWA 334.23 310.41
Operational Risk — RWA 373.17 497.53
Total RWA 5,448.96 6,071.13
Total capital adequacy ratio 17.02% 16.64%
CET1 capital adequacy ratio 12.78% 13.00%
Tier-1 capital adequacy ratio 12.78% 13.09%
Tier-2 capital adequacy ratio 4.24% 3.55%
1. All amounts have been rounded off to the nearest ` 10.0 million.
At March 31, 2016, the Bank’s Tier-1 capital adequacy ratio was 13.09% as against the requirement of 7.63% and total
capital adequacy ratio was 16.64% as against the requirement of 9.63%.
Movement in the capital funds and risk weighted assets from March 31, 2015 to March 31, 2016 as per Basel III norms
Capital funds (net of deductions) increased by ` 82.51 billion from ` 927.44 billion at March 31, 2015 to ` 1,009.95 billion at
March 31, 2016 primarily due to inclusion of retained earnings for scal 2016, amendments in guidelines for recognition of
FCTR at a discount of 25% and revaluation reserve at a discount of 55% in CET1 capital, risk weighting of deferred tax assets
at 250% instead of full deduction from Tier-1 capital and lower deduction for investment in subsidiaries due to repatriation
of capital from an overseas banking subsidiary and sale of shareholding in insurance subsidiaries, offset, in part, by a
decrease in the eligible amount of non-common equity capital due to application of Basel III grandfathering rules.
Credit risk RWA increased by ` 521.63 billion from ` 4,741.56 billion at March 31, 2015 to ` 5,263.19 billion at March 31,
2016 primarily due to an increase of ` 534.98 billion in RWA for on-balance sheet assets, offset, in part, by a decrease of
` 13.35 billion in RWA for off-balance sheet assets.
Market risk RWA decreased by ` 23.82 billion from ` 334.23 billion at March 31, 2015 to ` 310.41 billion at March 31, 2016
primarily due to a decrease in interest rate related positions.
Operational risk RWA increased by ` 124.36 billion from ` 373.17 billion at March 31, 2015 to ` 497.53 billion at March 31,
2016. The operational risk capital charge is computed based on 15% of the average of the previous three nancial years’
gross income and is revised on an annual basis at June 30. RWA is arrived at by multiplying the capital charge by 12.5.
Internal assessment of capital
The capital management framework of the Bank includes a comprehensive internal capital adequacy assessment process
conducted annually, which determines the adequate level of capitalisation necessary to meet regulatory norms and
current and future business needs, including under stress scenarios. The internal capital adequacy assessment process is
undertaken at both the standalone bank level and the consolidated group level. The internal capital adequacy assessment
process encompasses capital planning for a four-year time horizon, identication and measurement of material risks and
the relationship between risk and capital.
The capital management framework is complemented by the risk management framework, which covers the policies,
processes, methodologies and frameworks established for the management of material risks. Stress testing, which is a
key aspect of the internal capital adequacy assessment process and the risk management framework, provides an insight
into the impact of extreme but plausible scenarios on the Bank’s risk prole and capital position. Based on the stress
testing framework approved by the Board, the Bank conducts stress tests on various portfolios and assesses the impact