ICICI Bank 2016 Annual Report Download - page 100
Download and view the complete annual report
Please find page 100 of the 2016 ICICI Bank annual report below. You can navigate through the pages in the report by either clicking on the pages listed below, or by using the keyword search tool below to find specific information within the annual report.-
 1
1 -
2
-
3
-
4
-
5
-
6
-
7
-
8
-
9
-
10
-
11
-
12
-
13
-
14
-
15
-
16
-
17
-
18
-
19
-
20
-
21
-
22
-
23
-
24
-
25
-
26
-
27
-
28
-
29
-
30
-
31
-
32
-
33
-
34
-
35
-
36
-
37
-
38
-
39
-
40
-
41
-
42
-
43
-
44
-
45
-
46
-
47
-
48
-
49
-
50
-
51
-
52
-
53
-
54
-
55
-
56
-
57
-
58
-
59
-
60
-
61
-
62
-
63
-
64
-
65
-
66
-
67
-
68
-
69
-
70
-
71
-
72
-
73
-
74
-
75
-
76
-
77
-
78
-
79
-
80
-
81
-
82
-
83
-
84
-
85
-
86
-
87
-
88
-
89
-
 90
90 -
 91
91 -
 92
92 -
 93
93 -
 94
94 -
 95
95 -
 96
96 -
 97
97 -
 98
98 -
 99
99 -
 100
100 -
 101
101 -
 102
102 -
 103
103 -
 104
104 -
 105
105 -
 106
106 -
 107
107 -
 108
108 -
 109
109 -
 110
110 -
111
-
112
-
113
-
114
-
115
-
116
-
117
-
118
-
119
-
120
-
121
-
122
-
123
-
124
-
125
-
126
-
127
-
128
-
129
-
130
-
131
-
132
-
133
-
134
-
135
-
136
-
137
-
138
-
139
-
140
-
141
-
142
-
143
-
144
-
145
-
146
-
147
-
148
-
149
-
150
-
151
-
152
-
153
-
154
-
155
-
156
-
157
-
158
-
159
-
160
-
161
-
162
-
163
-
164
-
165
-
166
-
167
-
168
-
169
-
170
-
171
-
172
-
173
-
174
-
175
-
176
-
177
-
178
-
179
-
180
-
181
-
182
-
183
-
184
-
185
-
186
-
187
-
188
-
189
-
190
-
191
-
192
-
193
-
194
-
195
-
196
-
197
-
198
-
199
-
200
-
201
-
202
-
203
-
204
-
205
-
206
-
207
-
208
-
209
-
210
-
211
-
212
-
213
-
214
-
215
-
216
-
217
-
218
-
219
-
220
-
221
-
222
-
223
-
224
-
225
-
226
-
227
-
228
-
229
-
230
-
231
-
232
-
233
-
234
-
235
-
236
-
237
-
238
-
239
-
240
-
241
-
242
-
243
-
244
-
245
-
246
-
247
-
248
-
249
-
250
-
251
-
252
 |
 |
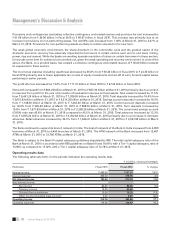
98
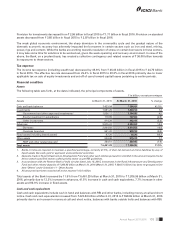
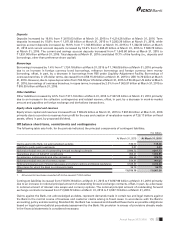
Management’s Discussion & Analysis
Annual Report 2015-2016
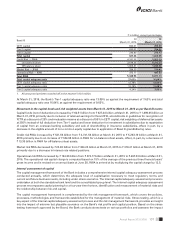
Net interest income increased by 11.5% from ` 190.40 billion in scal 2015 to ` 212.24 billion in scal 2016 reecting an
increase of 11.1% in the average volume of interest-earning assets.
The yield on average interest-earning assets decreased by 29 basis points from 8.96% in scal 2015 to 8.67% in scal
2016. The cost of funds decreased by 32 basis points from 6.17% in scal 2015 to 5.85% in scal 2016. The interest
spread increased by 3 basis points from 2.79% in scal 2015 to 2.82% in scal 2016. Net interest margin increased
marginally by 1 basis point from 3.48% in scal 2015 to 3.49% in scal 2016.
The net interest margin on domestic operations decreased by 7 basis points from 3.90% in scal 2015 to 3.83% in scal
2016 primarily due to a decrease in the yield on interest-earning assets, offset, in part, by a decrease in the cost of funds.
The yield on interest-earning assets decreased primarily due to a decrease in the yield on advances and investments,
offset, in part, by an increase in the yield on other interest-earning assets. The cost of funds decreased primarily due to
a decrease in cost of term deposits and cost of borrowings.
Net interest margin of overseas branches increased from 1.65% in scal 2015 to 1.86% in scal 2016 primarily due to
a decrease in cost of funds. Cost of funds decreased primarily due to re-pricing/prepayment of high-cost borrowings.
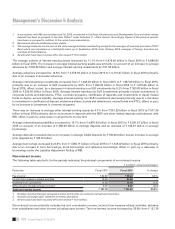
The following table sets forth, for the periods indicated, the trend in yield, cost, spread and margin.
Fiscal 2015 Fiscal 2016
Yield on interest-earning assets 8.96% 8.67%
- On advances 9.95 9.47
- On investments1 7.87 7.61
- On SLR investments 8.01 7.84
- On other investments1 7.49 6.83
- On other interest-earning assets1 5.20 5.49
Cost of interest-bearing liabilities 6.17 5.85
- Cost of deposits 6.18 5.88
- Current and savings account (CASA) deposits 3.00 3.00
- Term deposits 8.25 7.86
- Cost of borrowings 6.16 5.77
Interest spread 2.79 2.82
Net interest margin 3.48% 3.49%
1. In accordance with the Reserve Bank of India circular dated July 16, 2015, investment in the Rural Infrastructure and Development
Fund and other related deposits has been re-grouped to line item ‘Others’ under Schedule 11 - Other Assets and interest on the
Rural Infrastructure and Development Fund and other related deposits has been re-grouped from line item ‘income on investments’
to ‘Others’. Accordingly, figures of the previous periods have been re-grouped to conform to the current year presentation.
The yield on average interest-earning assets decreased primarily due to the following factors:
The yield on average interest-earning assets decreased by 29 basis points from 8.96% in scal 2015 to 8.67% in
scal 2016 primarily due to a decrease in yield on advances and yield on investments, offset, in part, by an increase
in proportion of average advances in total interest-earning assets. The yield on average advances decreased by 48
basis points from 9.95% in scal 2015 to 9.47% in scal 2016 and yield on average investments decreased by 26
basis points from 7.87% in scal 2015 to 7.61% in scal 2016.
The yield on advances was impacted by an increase in non-performing assets during scal 2016, as interest income
is not accrued on non-performing assets. The yield on domestic advances decreased by 78 basis points from 11.85%
in scal 2015 to 11.07% in scal 2016 primarily due to the above and a reduction in the base rate by 65 basis points
during scal 2016. The yield on overseas advances decreased by 10 basis points from 4.44% in scal 2015 to 4.34%
in scal 2016. However, the overall yield on average advances decreased by 48 basis points from 9.95% in scal
2015 to 9.47% in scal 2016 reecting the positive impact of the increase in the proportion of domestic advances in
total advances.