ICICI Bank 2016 Annual Report Download - page 113
Download and view the complete annual report
Please find page 113 of the 2016 ICICI Bank annual report below. You can navigate through the pages in the report by either clicking on the pages listed below, or by using the keyword search tool below to find specific information within the annual report.-
 1
1 -
2
-
3
-
4
-
5
-
6
-
7
-
8
-
9
-
10
-
11
-
12
-
13
-
14
-
15
-
16
-
17
-
18
-
19
-
20
-
21
-
22
-
23
-
24
-
25
-
26
-
27
-
28
-
29
-
30
-
31
-
32
-
33
-
34
-
35
-
36
-
37
-
38
-
39
-
40
-
41
-
42
-
43
-
44
-
45
-
46
-
47
-
48
-
49
-
50
-
51
-
52
-
53
-
54
-
55
-
56
-
57
-
58
-
59
-
60
-
61
-
62
-
63
-
64
-
65
-
66
-
67
-
68
-
69
-
70
-
71
-
72
-
73
-
74
-
75
-
76
-
77
-
78
-
79
-
80
-
81
-
82
-
83
-
84
-
85
-
86
-
87
-
88
-
89
-
90
-
91
-
92
-
93
-
94
-
95
-
96
-
97
-
98
-
99
-
100
-
101
-
102
-
 103
103 -
 104
104 -
 105
105 -
 106
106 -
 107
107 -
 108
108 -
 109
109 -
 110
110 -
 111
111 -
 112
112 -
 113
113 -
 114
114 -
 115
115 -
 116
116 -
 117
117 -
 118
118 -
 119
119 -
 120
120 -
 121
121 -
 122
122 -
 123
123 -
124
-
125
-
126
-
127
-
128
-
129
-
130
-
131
-
132
-
133
-
134
-
135
-
136
-
137
-
138
-
139
-
140
-
141
-
142
-
143
-
144
-
145
-
146
-
147
-
148
-
149
-
150
-
151
-
152
-
153
-
154
-
155
-
156
-
157
-
158
-
159
-
160
-
161
-
162
-
163
-
164
-
165
-
166
-
167
-
168
-
169
-
170
-
171
-
172
-
173
-
174
-
175
-
176
-
177
-
178
-
179
-
180
-
181
-
182
-
183
-
184
-
185
-
186
-
187
-
188
-
189
-
190
-
191
-
192
-
193
-
194
-
195
-
196
-
197
-
198
-
199
-
200
-
201
-
202
-
203
-
204
-
205
-
206
-
207
-
208
-
209
-
210
-
211
-
212
-
213
-
214
-
215
-
216
-
217
-
218
-
219
-
220
-
221
-
222
-
223
-
224
-
225
-
226
-
227
-
228
-
229
-
230
-
231
-
232
-
233
-
234
-
235
-
236
-
237
-
238
-
239
-
240
-
241
-
242
-
243
-
244
-
245
-
246
-
247
-
248
-
249
-
250
-
251
-
252
 |
 |

111Annual Report 2015-2016
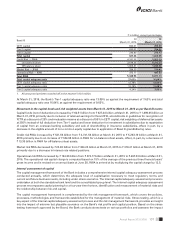
RBI also has separate guidelines for restructured loans. Upto March 31, 2015, a fully secured standard asset could be
restructured by re-schedulement of principal repayments and/or the interest element, but had to be separately disclosed
as a restructured asset. The diminution in the fair value of the restructured loan, if any, measured in present value terms,
was either written off or a provision was made to the extent of the diminution involved. Similar guidelines applied for
restructuring of non-performing loans. Loans restructured after April 1, 2015 (excluding loans given for implementation
of projects in the infrastructure sector and non-infrastructure sector and which are delayed up to a specied period) by
re-schedulement of principal repayments and/or the interest element are classied as non-performing. For such loans,
the diminution in the fair value of the loan, if any, measured in present value terms, has to be provided for in addition to
the provisions applicable to non-performing loans.
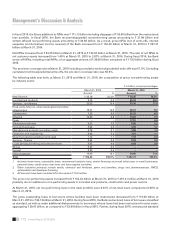
The following table sets forth, at the dates indicated, information regarding the Bank’s gross non-performing assets (net
of write-offs, interest suspense and derivative income reversals).
` in billion
March 31, 2015 March 31, 2016
Non-performing assets
Sub-standard assets ` 26.27 ` 40.91
Doubtful assets 100.63 195.94
Loss assets 25.52 30.36
Total non-performing assets1` 152.42 ` 267.21
1. Include advances, lease receivables and credit substitutes like debentures and bonds. Excludes preference shares.
2. All amounts have been rounded off to the nearest ` 10.0 million.
The following table sets forth, at the dates indicated, information regarding the Bank’s non-performing assets (NPAs).
` in billion, except percentages
Year ended Gross
NPA1
Net
NPA
Net customer
assets2
% of net NPA to net
customer assets2
March 31, 2013 ` 96.47 ` 22.34 ` 3,517.62 0.64%
March 31, 2014 ` 105.54 ` 33.01 ` 4,037.08 0.82%
March 31, 2015 ` 152.42 ` 63.25 ` 4,516.34 1.40%
March 31, 2016 ` 267.21 ` 132.97 ` 4,972.29 2.67%
1. Net of write-offs, interest suspense and derivatives income reversal.
2. Include advances, lease receivables and credit substitutes like debentures and bonds. Excludes preference shares.
3. All amounts have been rounded off to the nearest ` 10.0 million.
From scal 2012, the Indian economy experienced a slowdown in growth, particularly in capital investments; high interest
rates due to high ination; and signicant currency depreciation. Indian companies experienced a decline in sales and
prot growth and also an elongation of working capital cycles and a high level of receivables. Given the concerns over
growth, companies found it difcult to access other sources of funding, resulting in high leverage. As a result, the Indian
banking sector, including the Bank, experienced a rise in non-performing assets and restructured loans. Over the past two
years, the domestic economic recovery has been gradual and the global economic environment has become challenging.
Fiscal 2016 witnessed a slowdown in global economic growth mainly on account of lower growth in China and emerging
market economies, divergence in global monetary policy and signicant decline in commodity prices including crude
oil and metals. Due to the increased level of risks in the business environment, the Indian banking system in general has
experienced an increase in the level of additions to non-performing loans including slippages from restructured loans
into non-performing status. During three months ended December 31, 2015, RBI articulated the objective of early and
conservative recognition of stress and provisioning, held discussions with and asked a number of Indian banks to review
certain loan accounts and their classication over the three months ended December 31, 2015 and three months ended
March 31, 2016, through its Asset Quality Review. As a result of the above factors, non-performing loans of the Bank
increased signicantly in the second half of scal 2016.