ICICI Bank 2016 Annual Report Download - page 152
Download and view the complete annual report
Please find page 152 of the 2016 ICICI Bank annual report below. You can navigate through the pages in the report by either clicking on the pages listed below, or by using the keyword search tool below to find specific information within the annual report.-
 1
1 -
2
-
3
-
4
-
5
-
6
-
7
-
8
-
9
-
10
-
11
-
12
-
13
-
14
-
15
-
16
-
17
-
18
-
19
-
20
-
21
-
22
-
23
-
24
-
25
-
26
-
27
-
28
-
29
-
30
-
31
-
32
-
33
-
34
-
35
-
36
-
37
-
38
-
39
-
40
-
41
-
42
-
43
-
44
-
45
-
46
-
47
-
48
-
49
-
50
-
51
-
52
-
53
-
54
-
55
-
56
-
57
-
58
-
59
-
60
-
61
-
62
-
63
-
64
-
65
-
66
-
67
-
68
-
69
-
70
-
71
-
72
-
73
-
74
-
75
-
76
-
77
-
78
-
79
-
80
-
81
-
82
-
83
-
84
-
85
-
86
-
87
-
88
-
89
-
90
-
91
-
92
-
93
-
94
-
95
-
96
-
97
-
98
-
99
-
100
-
101
-
102
-
103
-
104
-
105
-
106
-
107
-
108
-
109
-
110
-
111
-
112
-
113
-
114
-
115
-
116
-
117
-
118
-
119
-
120
-
121
-
122
-
123
-
124
-
125
-
126
-
127
-
128
-
129
-
130
-
131
-
132
-
133
-
134
-
135
-
136
-
137
-
138
-
139
-
140
-
141
-
 142
142 -
 143
143 -
 144
144 -
 145
145 -
 146
146 -
 147
147 -
 148
148 -
 149
149 -
 150
150 -
 151
151 -
 152
152 -
 153
153 -
 154
154 -
 155
155 -
 156
156 -
 157
157 -
 158
158 -
 159
159 -
 160
160 -
 161
161 -
 162
162 -
163
-
164
-
165
-
166
-
167
-
168
-
169
-
170
-
171
-
172
-
173
-
174
-
175
-
176
-
177
-
178
-
179
-
180
-
181
-
182
-
183
-
184
-
185
-
186
-
187
-
188
-
189
-
190
-
191
-
192
-
193
-
194
-
195
-
196
-
197
-
198
-
199
-
200
-
201
-
202
-
203
-
204
-
205
-
206
-
207
-
208
-
209
-
210
-
211
-
212
-
213
-
214
-
215
-
216
-
217
-
218
-
219
-
220
-
221
-
222
-
223
-
224
-
225
-
226
-
227
-
228
-
229
-
230
-
231
-
232
-
233
-
234
-
235
-
236
-
237
-
238
-
239
-
240
-
241
-
242
-
243
-
244
-
245
-
246
-
247
-
248
-
249
-
250
-
251
-
252
 |
 |
Annual Report 2015-2016150
Schedules
forming part of the Accounts (Contd.)
Financial Statements of ICICI Bank Limited
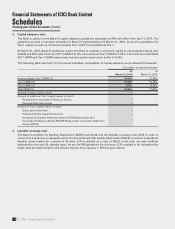
If the Bank had used the fair value of options based on binomial tree model, compensation cost in the year ended
March 31, 2016 would have been higher by ` 3,726.5 million and proforma prot after tax would have been
` 93.54 billion. On a proforma basis, the Bank’s basic and diluted earnings per share would have been ` 16.11 and
` 16.02 respectively. The key assumptions used to estimate the fair value of options granted during the year ended
March 31, 2016 are given below.
Risk-free interest rate 7.58% to 8.19%
Expected life 3.16 to 5.78 years
Expected volatility 30.67% to 32.77%
Expected dividend yield 1.62% to 2.11%
The weighted average fair value of options granted during the year ended March 31, 2016 is ` 100.50 (March 31,
2015: ` 90.09).
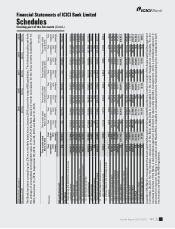
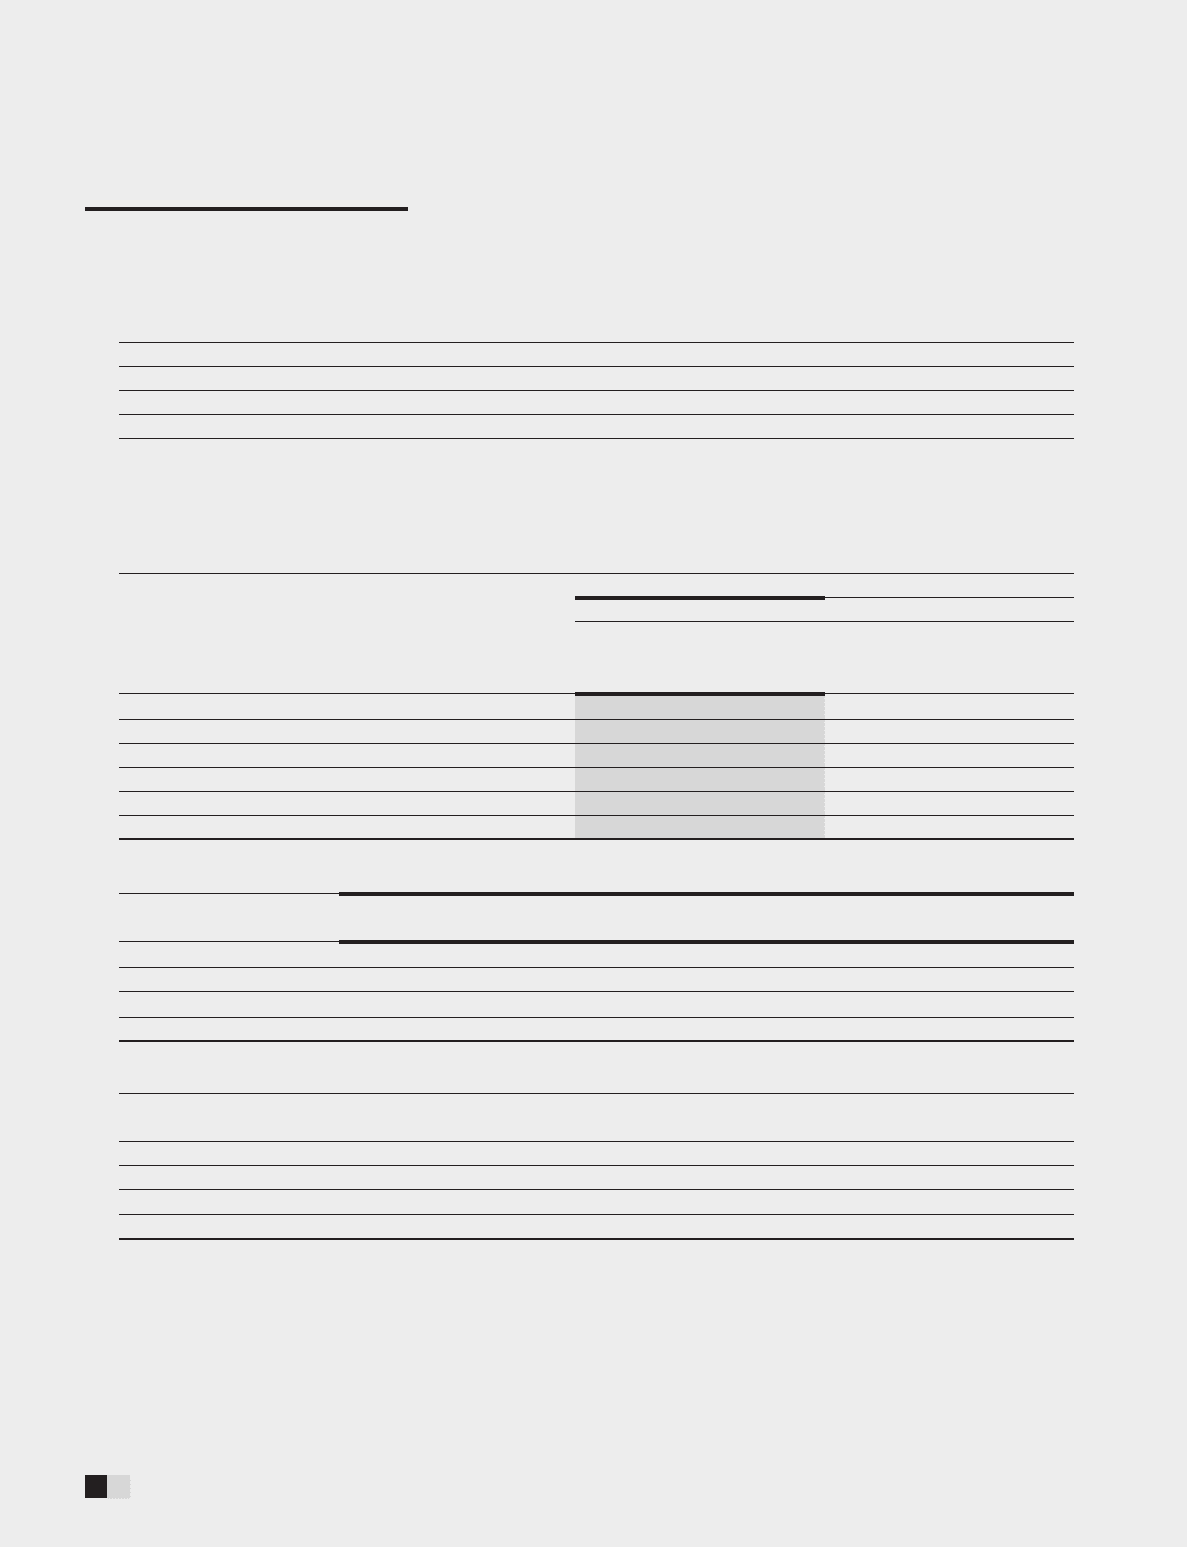
The following table sets forth, for the periods indicated, the summary of the status of the Bank’s stock option plan.
` except number of options
Particulars
Stock options outstanding
Year ended March 31, 2016 Year ended March 31, 2015
Number of
options
Weighted
average
exercise price
Number of
options
Weighted
average
exercise price
Outstanding at the beginning of the year 148,433,700 205.02 140,521,765 183.74
Add: Granted during the year 64,904,500 289.28 32,375,500 259.96
Less: Lapsed during the year, net of re-issuance 4,189,850 260.67 1,382,765 235.40
Less: Exercised during the year 17,523,785 161.16 23,080,800 150.66
Outstanding at the end of the year 191,624,565 236.36 148,433,700 205.02
Options exercisable 89,788,515 198.08 75,938,800 180.80
The following table sets forth, the summary of stock options outstanding at March 31, 2016.
Range of exercise price
(` per share)
Number of shares
arising out of options
Weighted average exercise
price (` per share)
Weighted average remaining
contractual life (Number of years)
60-99 2,556,700 86.96 3.03
100-199 60,755,715 180.24 3.65
200-299 96,037,150 251.67 7.85
300-399 32,275,000 308.26 9.08
The following table sets forth, the summary of stock options outstanding at March 31, 2015.
Range of exercise price
(` per share)
Number of shares
arising out of options
Weighted average
exercise price (` per share)
Weighted average remaining
contractual life (Number of years)
60-99 4,771,000 80.81 2.41
100-199 74,346,685 177.35 4.41
200-299 69,291,015 243.22 8.06
300-399 25,000 321.17 9.59
The options were exercised regularly throughout the period and weighted average share price as per NSE price
volume data during the year ended March 31, 2016 was ` 273.37 (March 31, 2015: ` 311.74).
9. Subordinated debt
During the year ended March 31, 2016, the Bank has not raised subordinated debt qualifying for Tier-2 capital (March
31, 2015: Nil).