ICICI Bank 2016 Annual Report Download - page 105
Download and view the complete annual report
Please find page 105 of the 2016 ICICI Bank annual report below. You can navigate through the pages in the report by either clicking on the pages listed below, or by using the keyword search tool below to find specific information within the annual report.-
 1
1 -
2
-
3
-
4
-
5
-
6
-
7
-
8
-
9
-
10
-
11
-
12
-
13
-
14
-
15
-
16
-
17
-
18
-
19
-
20
-
21
-
22
-
23
-
24
-
25
-
26
-
27
-
28
-
29
-
30
-
31
-
32
-
33
-
34
-
35
-
36
-
37
-
38
-
39
-
40
-
41
-
42
-
43
-
44
-
45
-
46
-
47
-
48
-
49
-
50
-
51
-
52
-
53
-
54
-
55
-
56
-
57
-
58
-
59
-
60
-
61
-
62
-
63
-
64
-
65
-
66
-
67
-
68
-
69
-
70
-
71
-
72
-
73
-
74
-
75
-
76
-
77
-
78
-
79
-
80
-
81
-
82
-
83
-
84
-
85
-
86
-
87
-
88
-
89
-
90
-
91
-
92
-
93
-
94
-
 95
95 -
 96
96 -
 97
97 -
 98
98 -
 99
99 -
 100
100 -
 101
101 -
 102
102 -
 103
103 -
 104
104 -
 105
105 -
 106
106 -
 107
107 -
 108
108 -
 109
109 -
 110
110 -
 111
111 -
 112
112 -
 113
113 -
 114
114 -
 115
115 -
116
-
117
-
118
-
119
-
120
-
121
-
122
-
123
-
124
-
125
-
126
-
127
-
128
-
129
-
130
-
131
-
132
-
133
-
134
-
135
-
136
-
137
-
138
-
139
-
140
-
141
-
142
-
143
-
144
-
145
-
146
-
147
-
148
-
149
-
150
-
151
-
152
-
153
-
154
-
155
-
156
-
157
-
158
-
159
-
160
-
161
-
162
-
163
-
164
-
165
-
166
-
167
-
168
-
169
-
170
-
171
-
172
-
173
-
174
-
175
-
176
-
177
-
178
-
179
-
180
-
181
-
182
-
183
-
184
-
185
-
186
-
187
-
188
-
189
-
190
-
191
-
192
-
193
-
194
-
195
-
196
-
197
-
198
-
199
-
200
-
201
-
202
-
203
-
204
-
205
-
206
-
207
-
208
-
209
-
210
-
211
-
212
-
213
-
214
-
215
-
216
-
217
-
218
-
219
-
220
-
221
-
222
-
223
-
224
-
225
-
226
-
227
-
228
-
229
-
230
-
231
-
232
-
233
-
234
-
235
-
236
-
237
-
238
-
239
-
240
-
241
-
242
-
243
-
244
-
245
-
246
-
247
-
248
-
249
-
250
-
251
-
252
 |
 |
103Annual Report 2015-2016
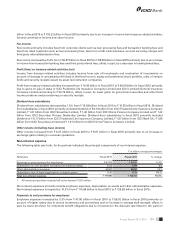
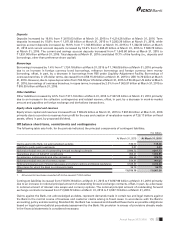
Provision for investments decreased from ` 2.98 billion in scal 2015 to ` 1.71 billion in scal 2016. Provision on standard
assets decreased from ` 3.85 billion in scal 2015 to ` 2.97 billion in scal 2016.
The weak global economic environment, the sharp downturn in the commodity cycle and the gradual nature of the
domestic economic recovery has adversely impacted the borrowers in certain sectors such as iron and steel, mining,
power, rigs and cement. While the banks are working towards resolution of stress on certain borrowers in these sectors,
it may take some time for solutions to be worked out, given the weak operating and recovery environment. In view of the
above, the Bank, on a prudent basis, has created a collective contingency and related reserve of ` 36.00 billion towards
its exposures to these sectors.
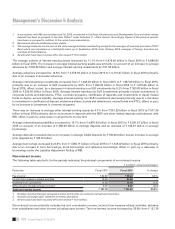
Tax expense
The income tax expense (including wealth tax) decreased by 46.8% from ` 46.45 billion in scal 2015 to ` 24.70 billion
in scal 2016. The effective tax rate decreased from 29.4% in scal 2015 to 20.3% in scal 2016 primarily due to lower
applicable tax on sale of equity investments and set-off of carry forward capital losses pertaining to earlier periods.
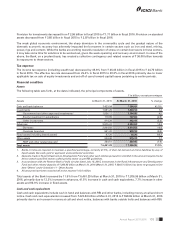
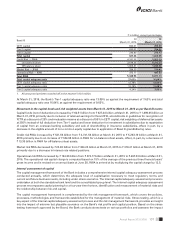
Financial condition
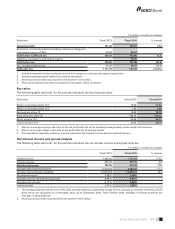
Assets
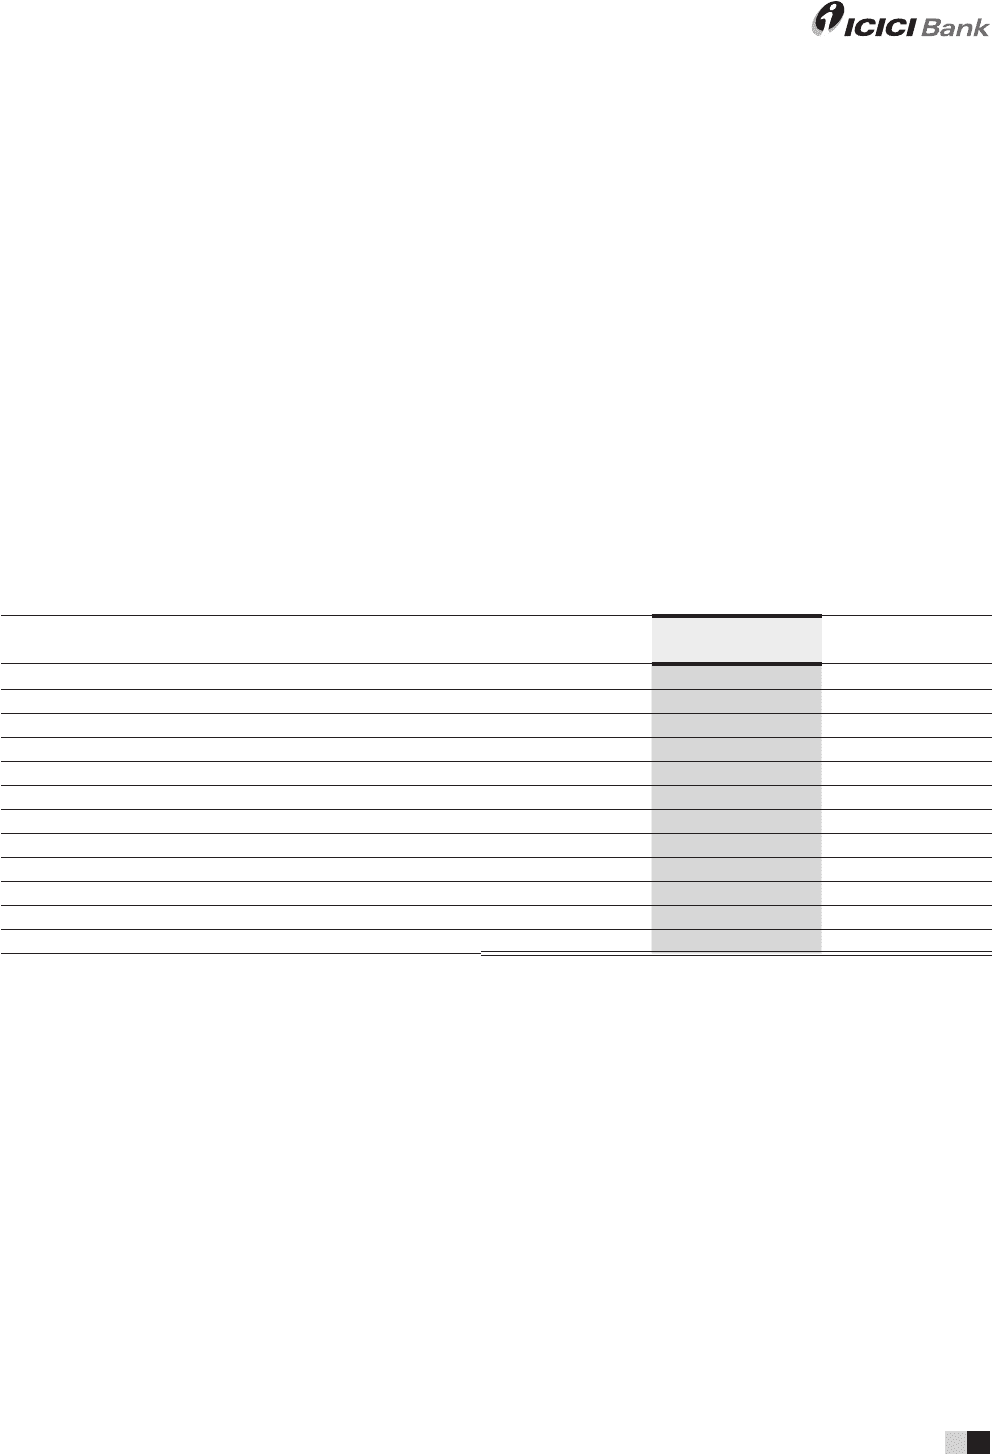
The following table sets forth, at the dates indicated, the principal components of assets.
` in billion, except percentages
Assets At March 31, 2015 At March 31, 2016 % change
Cash and bank balances ` 423.04 ` 598.69 41.5%
Investments 1,581.29 1,604.12 1.4
- Government and other approved investments1 1,056.11 1,104.05 4.5
- Equity investment in subsidiaries 110.89 107.63 (2.9)
- Other investments 414.29 392.44 (5.3)
Advances 3,875.22 4,352.64 12.3
- Domestic 2,934.02 3,414.52 16.4
- Overseas branches 941.20 938.12 (0.3)
Fixed assets (including leased assets) 47.26 75.76 60.3
Other assets 534.48 575.74 7.7
- RIDF and other related deposits2 284.51 280.66 (1.4)
Total assets ` 6,461.29 ` 7,206.95 11.5%
1. Banks in India are required to maintain a specified percentage, currently 21.5%, of their net demand and time liabilities by way of
liquid assets like cash, gold or approved unencumbered securities.
2. Deposits made in Rural Infrastructure Development Fund and other such entities pursuant to shortfall in the amount required to be
lent to certain specified sectors called priority sector as per RBI guidelines.
3. In accordance with the Reserve Bank of India circular dated July 16, 2015, investment in the Rural Infrastructure and Development
Fund and other related deposits of ` 280.66 billion at March 31, 2016 (March 31, 2015: ` 284.51 billion) has been re-grouped to line
item ‘Others’ under Schedule 11 - Other Assets.
4. All amounts have been rounded off to the nearest ` 10.0 million.
Total assets of the Bank increased by 11.5% from ` 6,461.29 billion at March 31, 2015 to ` 7,206.95 billion at March 31,
2016, primarily due to 12.3% increase in advances, 41.5% increase in cash and cash equivalents, 7.7% increase in other
assets and 60.3% increase in xed assets.
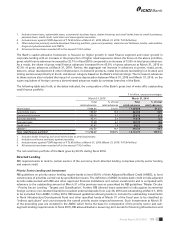
Cash and cash equivalents
Cash and cash equivalents include cash in hand and balances with RBI and other banks, including money at call and short
notice. Cash and cash equivalents increased from ` 423.04 billion at March 31, 2015 to ` 598.69 billion at March 31, 2016
primarily due to an increase in money at call and short notice, balances with banks outside India and balances with RBI.