ICICI Bank 2016 Annual Report Download - page 240
Download and view the complete annual report
Please find page 240 of the 2016 ICICI Bank annual report below. You can navigate through the pages in the report by either clicking on the pages listed below, or by using the keyword search tool below to find specific information within the annual report.-
 1
1 -
2
-
3
-
4
-
5
-
6
-
7
-
8
-
9
-
10
-
11
-
12
-
13
-
14
-
15
-
16
-
17
-
18
-
19
-
20
-
21
-
22
-
23
-
24
-
25
-
26
-
27
-
28
-
29
-
30
-
31
-
32
-
33
-
34
-
35
-
36
-
37
-
38
-
39
-
40
-
41
-
42
-
43
-
44
-
45
-
46
-
47
-
48
-
49
-
50
-
51
-
52
-
53
-
54
-
55
-
56
-
57
-
58
-
59
-
60
-
61
-
62
-
63
-
64
-
65
-
66
-
67
-
68
-
69
-
70
-
71
-
72
-
73
-
74
-
75
-
76
-
77
-
78
-
79
-
80
-
81
-
82
-
83
-
84
-
85
-
86
-
87
-
88
-
89
-
90
-
91
-
92
-
93
-
94
-
95
-
96
-
97
-
98
-
99
-
100
-
101
-
102
-
103
-
104
-
105
-
106
-
107
-
108
-
109
-
110
-
111
-
112
-
113
-
114
-
115
-
116
-
117
-
118
-
119
-
120
-
121
-
122
-
123
-
124
-
125
-
126
-
127
-
128
-
129
-
130
-
131
-
132
-
133
-
134
-
135
-
136
-
137
-
138
-
139
-
140
-
141
-
142
-
143
-
144
-
145
-
146
-
147
-
148
-
149
-
150
-
151
-
152
-
153
-
154
-
155
-
156
-
157
-
158
-
159
-
160
-
161
-
162
-
163
-
164
-
165
-
166
-
167
-
168
-
169
-
170
-
171
-
172
-
173
-
174
-
175
-
176
-
177
-
178
-
179
-
180
-
181
-
182
-
183
-
184
-
185
-
186
-
187
-
188
-
189
-
190
-
191
-
192
-
193
-
194
-
195
-
196
-
197
-
198
-
199
-
200
-
201
-
202
-
203
-
204
-
205
-
206
-
207
-
208
-
209
-
210
-
211
-
212
-
213
-
214
-
215
-
216
-
217
-
218
-
219
-
220
-
221
-
222
-
223
-
224
-
225
-
226
-
227
-
228
-
229
-
 230
230 -
 231
231 -
 232
232 -
 233
233 -
 234
234 -
 235
235 -
 236
236 -
 237
237 -
 238
238 -
 239
239 -
 240
240 -
 241
241 -
 242
242 -
 243
243 -
 244
244 -
 245
245 -
 246
246 -
 247
247 -
 248
248 -
 249
249 -
 250
250 -
251
-
252
 |
 |

Annual Report 2015-2016238
Schedules
forming part of the Consolidated Accounts (Contd.)
Consolidated Financial Statements
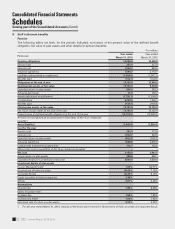
The following table sets forth, the business segment results for the year ended March 31, 2016.
` in million
Sr.
no. Particulars Retail
banking
Wholesale
banking Treasury Other banking
business
Life
insurance
General
insurance Others Inter- segment
adjustments Total
1 Revenue 391,878.0 328,923.5 483,414.5 39,343.1 231,798.6 66,995.2 46,484.7 (574,879.1) 1,013,958.5
2Segment results 38,977.4 (12,454.3) 86,162.7 6,790.0 17,715.8 7,076.9 14,251.9 (15,476.3) 143,044.1
3 Unallocated expenses –
4 Operating prot (2) – (3) 143,044.1
5 Income tax expenses (net)/
(net deferred tax credit) 33,775.2
6Net prot1 (4) – (5) 109,268.9
Other information
7 Segment assets 1,724,805.5 2,663,659.1 2,580,816.4 799,535.9 1,046,996.2 153,745.8 279,392.0 (146,320.0) 9,102,630.9
8 Unallocated assets2 84,931.1
9Total assets (7) + (8) 9,187,562.0
10 Segment liabilities 3,133,932.7 1,197,853.2 2,764,452.73 750,871.63 1,048,622.53 156,758.43 281,390.93 (146,320.0)3 9,187,562.0
11 Unallocated liabilities –
12 Total liabilities (10) + (11) 9,187,562.0
13 Capital expenditure 6,474.5 937.0 11.2 166.9 539.4 464.5 351.8 – 8,945.3
14 Depreciation 5,718.9 1,016.3 14.9 327.1 455.4 565.4 349.6 (16.5) 8,431.1
1. Includes share of net profit of minority shareholders.
2. Includes tax paid in advance/tax deducted at source (net), deferred tax asset (net).
3. Includes share capital and reserves and surplus.