ICICI Bank 2016 Annual Report Download - page 153
Download and view the complete annual report
Please find page 153 of the 2016 ICICI Bank annual report below. You can navigate through the pages in the report by either clicking on the pages listed below, or by using the keyword search tool below to find specific information within the annual report.-
 1
1 -
2
-
3
-
4
-
5
-
6
-
7
-
8
-
9
-
10
-
11
-
12
-
13
-
14
-
15
-
16
-
17
-
18
-
19
-
20
-
21
-
22
-
23
-
24
-
25
-
26
-
27
-
28
-
29
-
30
-
31
-
32
-
33
-
34
-
35
-
36
-
37
-
38
-
39
-
40
-
41
-
42
-
43
-
44
-
45
-
46
-
47
-
48
-
49
-
50
-
51
-
52
-
53
-
54
-
55
-
56
-
57
-
58
-
59
-
60
-
61
-
62
-
63
-
64
-
65
-
66
-
67
-
68
-
69
-
70
-
71
-
72
-
73
-
74
-
75
-
76
-
77
-
78
-
79
-
80
-
81
-
82
-
83
-
84
-
85
-
86
-
87
-
88
-
89
-
90
-
91
-
92
-
93
-
94
-
95
-
96
-
97
-
98
-
99
-
100
-
101
-
102
-
103
-
104
-
105
-
106
-
107
-
108
-
109
-
110
-
111
-
112
-
113
-
114
-
115
-
116
-
117
-
118
-
119
-
120
-
121
-
122
-
123
-
124
-
125
-
126
-
127
-
128
-
129
-
130
-
131
-
132
-
133
-
134
-
135
-
136
-
137
-
138
-
139
-
140
-
141
-
142
-
 143
143 -
 144
144 -
 145
145 -
 146
146 -
 147
147 -
 148
148 -
 149
149 -
 150
150 -
 151
151 -
 152
152 -
 153
153 -
 154
154 -
 155
155 -
 156
156 -
 157
157 -
 158
158 -
 159
159 -
 160
160 -
 161
161 -
 162
162 -
 163
163 -
164
-
165
-
166
-
167
-
168
-
169
-
170
-
171
-
172
-
173
-
174
-
175
-
176
-
177
-
178
-
179
-
180
-
181
-
182
-
183
-
184
-
185
-
186
-
187
-
188
-
189
-
190
-
191
-
192
-
193
-
194
-
195
-
196
-
197
-
198
-
199
-
200
-
201
-
202
-
203
-
204
-
205
-
206
-
207
-
208
-
209
-
210
-
211
-
212
-
213
-
214
-
215
-
216
-
217
-
218
-
219
-
220
-
221
-
222
-
223
-
224
-
225
-
226
-
227
-
228
-
229
-
230
-
231
-
232
-
233
-
234
-
235
-
236
-
237
-
238
-
239
-
240
-
241
-
242
-
243
-
244
-
245
-
246
-
247
-
248
-
249
-
250
-
251
-
252
 |
 |

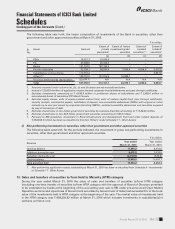
Annual Report 2015-2016 151
Schedules
forming part of the Accounts (Contd.)
Financial Statements of ICICI Bank Limited
10. Repurchase transactions
The following tables set forth, for the periods indicated, the details of securities sold and purchased under repo and
reverse repo transactions respectively including transactions under Liquidity Adjustment Facility (LAF) and Marginal
Standing Facility (MSF).
` in million
Minimum
outstanding
balance during the
Maximum
outstanding
balance during the
Daily average
outstanding
balance during the
Outstanding
balance at
March 31, 2016
Year ended March 31, 2016
Securities sold under Repo, LAF and MSF
i) Government Securities 10.2 133,067.0 51,943.4 40,129.4
ii) Corporate Debt Securities –2,000.0 13.7 –
Securities purchased under Reverse Repo and LAF
i) Government Securities –61,600.0 8,761.4 32,500.0
ii) Corporate Debt Securities –750.0 186.5 –
1. Amounts reported are based on face value of securities under repo, reverse repo, LAF and MSF.
` in million
Minimum
outstanding
balance during the
Maximum
outstanding
balance during the
Daily average
outstanding
balance during the
Outstanding
balance at
March 31, 2015
Year ended March 31, 2015
Securities sold under Repo and LAF
i) Government Securities 54.0 153,941.9 66,700.1 128,782.2
ii) Corporate Debt Securities – – – –
Securities purchased under Reverse Repo and LAF
i) Government Securities – 105,439.7 10,113.8 –
ii) Corporate Debt Securities – – – –
1. Amounts reported are based on face value of securities under repo, reverse repo, LAF and MSF.
11. Investments
The following table sets forth, for the periods indicated, the details of investments and the movement of provision
held towards depreciation on investments of the Bank.
` in million
Particulars At
March 31, 2016
At
March 31, 2015
1. Value of Investments1
i) Gross value of investments
a) In India 1,554,622.3 1,529,085.4
b) Outside India 82,517.5 79,061.7
ii) Provision for depreciation
c) In India (32,015.5) (26,293.6)
d) Outside India (1,006.3) (561.3)
iii) Net value of investments
e) In India 1,522,606.8 1,502,791.8
f) Outside India 81,511.2 78,500.4