ICICI Bank 2016 Annual Report Download - page 118
Download and view the complete annual report
Please find page 118 of the 2016 ICICI Bank annual report below. You can navigate through the pages in the report by either clicking on the pages listed below, or by using the keyword search tool below to find specific information within the annual report.-
 1
1 -
2
-
3
-
4
-
5
-
6
-
7
-
8
-
9
-
10
-
11
-
12
-
13
-
14
-
15
-
16
-
17
-
18
-
19
-
20
-
21
-
22
-
23
-
24
-
25
-
26
-
27
-
28
-
29
-
30
-
31
-
32
-
33
-
34
-
35
-
36
-
37
-
38
-
39
-
40
-
41
-
42
-
43
-
44
-
45
-
46
-
47
-
48
-
49
-
50
-
51
-
52
-
53
-
54
-
55
-
56
-
57
-
58
-
59
-
60
-
61
-
62
-
63
-
64
-
65
-
66
-
67
-
68
-
69
-
70
-
71
-
72
-
73
-
74
-
75
-
76
-
77
-
78
-
79
-
80
-
81
-
82
-
83
-
84
-
85
-
86
-
87
-
88
-
89
-
90
-
91
-
92
-
93
-
94
-
95
-
96
-
97
-
98
-
99
-
100
-
101
-
102
-
103
-
104
-
105
-
106
-
107
-
 108
108 -
 109
109 -
 110
110 -
 111
111 -
 112
112 -
 113
113 -
 114
114 -
 115
115 -
 116
116 -
 117
117 -
 118
118 -
 119
119 -
 120
120 -
 121
121 -
 122
122 -
 123
123 -
 124
124 -
 125
125 -
 126
126 -
 127
127 -
 128
128 -
129
-
130
-
131
-
132
-
133
-
134
-
135
-
136
-
137
-
138
-
139
-
140
-
141
-
142
-
143
-
144
-
145
-
146
-
147
-
148
-
149
-
150
-
151
-
152
-
153
-
154
-
155
-
156
-
157
-
158
-
159
-
160
-
161
-
162
-
163
-
164
-
165
-
166
-
167
-
168
-
169
-
170
-
171
-
172
-
173
-
174
-
175
-
176
-
177
-
178
-
179
-
180
-
181
-
182
-
183
-
184
-
185
-
186
-
187
-
188
-
189
-
190
-
191
-
192
-
193
-
194
-
195
-
196
-
197
-
198
-
199
-
200
-
201
-
202
-
203
-
204
-
205
-
206
-
207
-
208
-
209
-
210
-
211
-
212
-
213
-
214
-
215
-
216
-
217
-
218
-
219
-
220
-
221
-
222
-
223
-
224
-
225
-
226
-
227
-
228
-
229
-
230
-
231
-
232
-
233
-
234
-
235
-
236
-
237
-
238
-
239
-
240
-
241
-
242
-
243
-
244
-
245
-
246
-
247
-
248
-
249
-
250
-
251
-
252
 |
 |

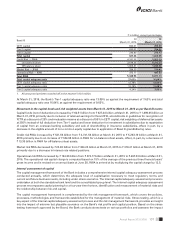
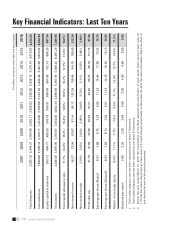
116 Annual Report 2015-2016
(` in billion, except per share data and percentages)
2007 2008 2009 2010 2011 2012 2013 2014 2015 2016
Total deposits 2,305.10 2,444.31 2,183.48 2,020.17 2,256.02 2,555.00 2,926.14 3,319.14 3,615.63 4,214.26
Total advances 1,958.66 2,256.16 2,183.11 1,812.06 2,163.66 2,537.28 2,902.49 3,387.03 3,875.22 4,352.64
Equity capital & reserves 243.13 464.71 495.33 516.18 550.91 604.05 667.06 732.13 804.29 897.36
Total assets 3,446.58 3,997.95 3,793.01 3,634.00 4,062.34 4,890.69 5,367.95 5,946.42 6,461.29 7,206.95
Total capital adequacy ratio 11.7% 14.0%115.5%119.4%119.5%118.5%118.7%117.7%217.0%216.6%2
Net interest income 56.37 73.04 83.67 81.14 90.17 107.34 138.66 164.75 190.40 212.24
Net interest margin 2.19% 2.22% 2.43% 2.49% 2.64% 2.73% 3.11% 3.33% 3.48% 3.49%
Prot after tax 31.10 41.58 37.58 40.25 51.51 64.65 83.25 98.10 111.75 97.26
Earnings per share (Basic)36.97 7.88 6.75 7.23 9.05 11.22 14.44 17.00 19.32 16.75
Earnings per share (Diluted)36.93 7.83 6.74 7.20 9.01 11.19 14.39 16.93 19.13 16.65
Return on average equity 13.4% 11.1% 7.7% 7.9% 9.6% 11.1% 12.9% 13.7% 14.3% 11.3%
Dividend per share32.00 2.20 2.20 2.40 2.80 3.30 4.00 4.60 5.00 5.00
1. Total capital adequacy ratio has been calculated as per Basel II framework.
2. Total capital adequacy ratio has been calculated as per Basel III framework.
3. During the year ended March 31, 2015, the shareholders of the Bank approved the sub-division of each equity share having a face value of
` 10 into five equity shares having a face value of ` 2 each through postal ballot on November 20, 2014. Per share information reflect the effect of
sub-division for each of the periods presented.
Key Financial Indicators: Last Ten Years