ICICI Bank 2016 Annual Report Download - page 173
Download and view the complete annual report
Please find page 173 of the 2016 ICICI Bank annual report below. You can navigate through the pages in the report by either clicking on the pages listed below, or by using the keyword search tool below to find specific information within the annual report.-
 1
1 -
2
-
3
-
4
-
5
-
6
-
7
-
8
-
9
-
10
-
11
-
12
-
13
-
14
-
15
-
16
-
17
-
18
-
19
-
20
-
21
-
22
-
23
-
24
-
25
-
26
-
27
-
28
-
29
-
30
-
31
-
32
-
33
-
34
-
35
-
36
-
37
-
38
-
39
-
40
-
41
-
42
-
43
-
44
-
45
-
46
-
47
-
48
-
49
-
50
-
51
-
52
-
53
-
54
-
55
-
56
-
57
-
58
-
59
-
60
-
61
-
62
-
63
-
64
-
65
-
66
-
67
-
68
-
69
-
70
-
71
-
72
-
73
-
74
-
75
-
76
-
77
-
78
-
79
-
80
-
81
-
82
-
83
-
84
-
85
-
86
-
87
-
88
-
89
-
90
-
91
-
92
-
93
-
94
-
95
-
96
-
97
-
98
-
99
-
100
-
101
-
102
-
103
-
104
-
105
-
106
-
107
-
108
-
109
-
110
-
111
-
112
-
113
-
114
-
115
-
116
-
117
-
118
-
119
-
120
-
121
-
122
-
123
-
124
-
125
-
126
-
127
-
128
-
129
-
130
-
131
-
132
-
133
-
134
-
135
-
136
-
137
-
138
-
139
-
140
-
141
-
142
-
143
-
144
-
145
-
146
-
147
-
148
-
149
-
150
-
151
-
152
-
153
-
154
-
155
-
156
-
157
-
158
-
159
-
160
-
161
-
162
-
 163
163 -
 164
164 -
 165
165 -
 166
166 -
 167
167 -
 168
168 -
 169
169 -
 170
170 -
 171
171 -
 172
172 -
 173
173 -
 174
174 -
 175
175 -
 176
176 -
 177
177 -
 178
178 -
 179
179 -
 180
180 -
 181
181 -
 182
182 -
 183
183 -
184
-
185
-
186
-
187
-
188
-
189
-
190
-
191
-
192
-
193
-
194
-
195
-
196
-
197
-
198
-
199
-
200
-
201
-
202
-
203
-
204
-
205
-
206
-
207
-
208
-
209
-
210
-
211
-
212
-
213
-
214
-
215
-
216
-
217
-
218
-
219
-
220
-
221
-
222
-
223
-
224
-
225
-
226
-
227
-
228
-
229
-
230
-
231
-
232
-
233
-
234
-
235
-
236
-
237
-
238
-
239
-
240
-
241
-
242
-
243
-
244
-
245
-
246
-
247
-
248
-
249
-
250
-
251
-
252
 |
 |

Annual Report 2015-2016 171
Schedules
forming part of the Accounts (Contd.)
Financial Statements of ICICI Bank Limited
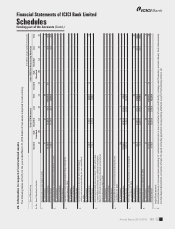
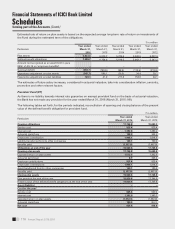
The following table sets forth, for the periods indicated, the summary of exposure to real estate sector.
` in million
Real estate sector At
March 31, 2016
At
March 31, 2015
I. Direct exposure 1,538,771.3 1,340,716.4
i) Residential mortgages
of which: individual housing loans eligible for priority sector advances
1,155,305.7 945,862.1
182,852.8 172,465.4
ii) Commercial real estate1351,808.5 356,451.4
iii) Investments in Mortgage Backed Securities (MBS) and other securitised
exposure 31,657.1 38,402.9
a. Residential 27,850.9 36,624.4
b. Commercial real estate 3,806.2 1,778.5
II. Indirect exposure 121,131.7 85,681.9
i) Fund based and non-fund based exposures on National Housing Bank
(NHB) and Housing Finance Companies (HFCs) 121,137.7 85,681.9
Total exposure to real estate sector21,659,903.0 1,426,398.3
1. Commercial real estate exposure include loans to individuals against non-residential premises, loans given to land and building
developers for construction, corporate loans for development of special economic zone, loans to borrowers where servicing of
loans is from a real estate activity and exposures to mutual funds/venture capital funds/private equity funds investing primarily
in the real estate companies.
2. Excludes non-banking assets acquired in satisfaction of claims.
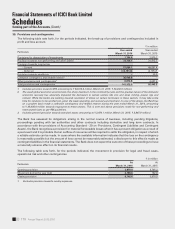
30. Factoring business
At March 31, 2016, the outstanding receivables acquired by the Bank under factoring business were ` 4,290.6 million
(March 31, 2015: ` 3,737.6).
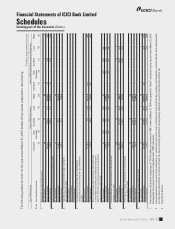
31. Risk category-wise country exposure
As per the extant RBI guidelines, the country exposure of the Bank is categorised into various risk categories listed in
the following table. The funded country exposure (net) of the Bank as a percentage of total funded assets for United
States of America was 2.51% (March 31, 2015: 2.53%), Singapore was 1.50% (March 31, 2015: 1.31%) and United
Kingdom was 1.50% (March 31, 2015: 0.52%). As the net funded exposure to United States of America, Singapore
and United Kingdom exceeds 1.0% of total funded assets, the Bank held a provision of ` 530.0 million on country
exposure at March 31, 2016 (March 31, 2015: ` 345.0 million) based on RBI guidelines.
The following table sets forth, for the periods indicated, the details of exposure (net) and provision held by the bank.
` in million
Risk category Exposure (net) at
March 31, 2016
Provision held at
March 31, 2016
Exposure (net) at
March 31, 2015
Provision held at
March 31, 2015
Insignicant 902,987.8 530.0 784,254.1 345.0
Low 204,850.4 – 189,069.3 –
Moderately Low 20,254.5 – 27,593.9 –
Moderate 15,425.1 – 10,823.3 –
Moderately High – – – –
High – – – –
Very High – – – –
Total 1,143,517.8 530.0 1,011,740.6 345.0