ICICI Bank 2016 Annual Report Download - page 237
Download and view the complete annual report
Please find page 237 of the 2016 ICICI Bank annual report below. You can navigate through the pages in the report by either clicking on the pages listed below, or by using the keyword search tool below to find specific information within the annual report.-
 1
1 -
2
-
3
-
4
-
5
-
6
-
7
-
8
-
9
-
10
-
11
-
12
-
13
-
14
-
15
-
16
-
17
-
18
-
19
-
20
-
21
-
22
-
23
-
24
-
25
-
26
-
27
-
28
-
29
-
30
-
31
-
32
-
33
-
34
-
35
-
36
-
37
-
38
-
39
-
40
-
41
-
42
-
43
-
44
-
45
-
46
-
47
-
48
-
49
-
50
-
51
-
52
-
53
-
54
-
55
-
56
-
57
-
58
-
59
-
60
-
61
-
62
-
63
-
64
-
65
-
66
-
67
-
68
-
69
-
70
-
71
-
72
-
73
-
74
-
75
-
76
-
77
-
78
-
79
-
80
-
81
-
82
-
83
-
84
-
85
-
86
-
87
-
88
-
89
-
90
-
91
-
92
-
93
-
94
-
95
-
96
-
97
-
98
-
99
-
100
-
101
-
102
-
103
-
104
-
105
-
106
-
107
-
108
-
109
-
110
-
111
-
112
-
113
-
114
-
115
-
116
-
117
-
118
-
119
-
120
-
121
-
122
-
123
-
124
-
125
-
126
-
127
-
128
-
129
-
130
-
131
-
132
-
133
-
134
-
135
-
136
-
137
-
138
-
139
-
140
-
141
-
142
-
143
-
144
-
145
-
146
-
147
-
148
-
149
-
150
-
151
-
152
-
153
-
154
-
155
-
156
-
157
-
158
-
159
-
160
-
161
-
162
-
163
-
164
-
165
-
166
-
167
-
168
-
169
-
170
-
171
-
172
-
173
-
174
-
175
-
176
-
177
-
178
-
179
-
180
-
181
-
182
-
183
-
184
-
185
-
186
-
187
-
188
-
189
-
190
-
191
-
192
-
193
-
194
-
195
-
196
-
197
-
198
-
199
-
200
-
201
-
202
-
203
-
204
-
205
-
206
-
207
-
208
-
209
-
210
-
211
-
212
-
213
-
214
-
215
-
216
-
217
-
218
-
219
-
220
-
221
-
222
-
223
-
224
-
225
-
226
-
 227
227 -
 228
228 -
 229
229 -
 230
230 -
 231
231 -
 232
232 -
 233
233 -
 234
234 -
 235
235 -
 236
236 -
 237
237 -
 238
238 -
 239
239 -
 240
240 -
 241
241 -
 242
242 -
 243
243 -
 244
244 -
 245
245 -
 246
246 -
 247
247 -
248
-
249
-
250
-
251
-
252
 |
 |

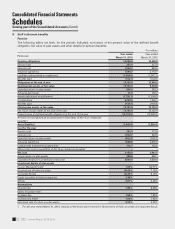
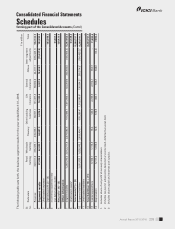
Annual Report 2015-2016 235
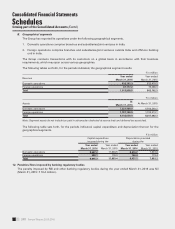
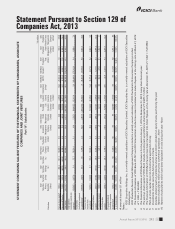
Schedules
forming part of the Consolidated Accounts (Contd.)
Consolidated Financial Statements
` in million
Particulars Year ended
March 31, 2016
Year ended
March 31, 2015
Opening obligations 20,683.7 18,356.2
Service cost 1,044.9 1,046.1
Interest cost 1,614.4 1,615.3
Actuarial (gain) / loss 252.5 325.7
Employees contribution 2,150.8 2,058.2
Obligations transferred from/to other companies 68.1 71.6
Benets paid (2,604.9) (2,789.4)
Obligations at end of the year 23,209.5 20,683.7
Opening plan assets 20,683.7 18,352.7
Expected return on plan assets 1,839.8 1,597.5
Actuarial gain / (loss) 27.1 347.0
Employer contributions 1,044.9 1,046.1
Employees contributions 2,150.8 2,058.2
Assets transfer from/to other companies 68.1 71.6
Benets paid (2,604.9) (2,789.4)
Closing plan assets 23,209.5 20,683.7
Plan assets at the end of the year 23,209.5 20,683.7
Present value of the dened benet obligations at the end of the year (23,209.5) (20,683.7)
Asset/(liability) – –
Cost for the year
Service cost 1,044.9 1,046.1
Interest cost 1,614.4 1,615.3
Expected return on plan assets (1,839.8) (1,597.5)
Actuarial (gain)/loss 225.4 (21.3)
Net cost 1,044.9 1,042.6
Actual return on plan assets 1,866.9 1,944.5
Expected employer's contribution next year 1,119.3 1,117.1
Investment details of plan assets
Government of India securities 42.48% 40.52%
Corporate Bonds 52.49% 53.06%
Special deposit scheme 2.35% 2.59%
Others 2.67% 3.83%
Assumptions
Discount rate 7.65%-7.95% 7.80%-7.95%
Expected rate of return on assets 8.22%-9.03% 8.12%-9.00%
Discount rate for the remaining term to maturity of investments 7.68%-7.95% 7.80%-7.97%
Average historic yield on the investment 8.14%-9.01% 8.19%-9.00%
Guaranteed rate of return 8.75% 8.75%