ICICI Bank 2016 Annual Report Download - page 101
Download and view the complete annual report
Please find page 101 of the 2016 ICICI Bank annual report below. You can navigate through the pages in the report by either clicking on the pages listed below, or by using the keyword search tool below to find specific information within the annual report.-
 1
1 -
2
-
3
-
4
-
5
-
6
-
7
-
8
-
9
-
10
-
11
-
12
-
13
-
14
-
15
-
16
-
17
-
18
-
19
-
20
-
21
-
22
-
23
-
24
-
25
-
26
-
27
-
28
-
29
-
30
-
31
-
32
-
33
-
34
-
35
-
36
-
37
-
38
-
39
-
40
-
41
-
42
-
43
-
44
-
45
-
46
-
47
-
48
-
49
-
50
-
51
-
52
-
53
-
54
-
55
-
56
-
57
-
58
-
59
-
60
-
61
-
62
-
63
-
64
-
65
-
66
-
67
-
68
-
69
-
70
-
71
-
72
-
73
-
74
-
75
-
76
-
77
-
78
-
79
-
80
-
81
-
82
-
83
-
84
-
85
-
86
-
87
-
88
-
89
-
90
-
 91
91 -
 92
92 -
 93
93 -
 94
94 -
 95
95 -
 96
96 -
 97
97 -
 98
98 -
 99
99 -
 100
100 -
 101
101 -
 102
102 -
 103
103 -
 104
104 -
 105
105 -
 106
106 -
 107
107 -
 108
108 -
 109
109 -
 110
110 -
 111
111 -
112
-
113
-
114
-
115
-
116
-
117
-
118
-
119
-
120
-
121
-
122
-
123
-
124
-
125
-
126
-
127
-
128
-
129
-
130
-
131
-
132
-
133
-
134
-
135
-
136
-
137
-
138
-
139
-
140
-
141
-
142
-
143
-
144
-
145
-
146
-
147
-
148
-
149
-
150
-
151
-
152
-
153
-
154
-
155
-
156
-
157
-
158
-
159
-
160
-
161
-
162
-
163
-
164
-
165
-
166
-
167
-
168
-
169
-
170
-
171
-
172
-
173
-
174
-
175
-
176
-
177
-
178
-
179
-
180
-
181
-
182
-
183
-
184
-
185
-
186
-
187
-
188
-
189
-
190
-
191
-
192
-
193
-
194
-
195
-
196
-
197
-
198
-
199
-
200
-
201
-
202
-
203
-
204
-
205
-
206
-
207
-
208
-
209
-
210
-
211
-
212
-
213
-
214
-
215
-
216
-
217
-
218
-
219
-
220
-
221
-
222
-
223
-
224
-
225
-
226
-
227
-
228
-
229
-
230
-
231
-
232
-
233
-
234
-
235
-
236
-
237
-
238
-
239
-
240
-
241
-
242
-
243
-
244
-
245
-
246
-
247
-
248
-
249
-
250
-
251
-
252
 |
 |

99Annual Report 2015-2016
The Reserve Bank of India reduced the repo rate by 125 basis points from 8.00% to 6.75% in four phases on January
15, 2015, March 4, 2015, June 2, 2015 and September 29, 2015. The Bank reduced its base rate by 65 basis points
from 10.00% to 9.35% in three phases - 25 basis points with effect from April 10, 2015, 5 basis points with effect from
June 26, 2015 and 35 basis points with effect from October 5, 2015.
The yield on average interest-earning investments decreased from 7.87% in scal 2015 to 7.61% in scal 2016 primarily
due to a decrease in the yield on Statutory Liquidity Ratio (SLR) investments. The yield on SLR investments decreased
by 17 basis points from 8.01% in scal 2015 to 7.84% in scal 2016 primarily due to softening of yield on Government
securities. The yield on non-SLR investments decreased by 66 basis points from 7.49% in scal 2015 to 6.83% in scal
2016 primarily due to a decrease in yield on bonds and debentures, certicate of deposits, pass through certicates
(PTCs) and commercial paper reecting softening of interest rates. In accordance with RBI circular dated July 16, 2015,
deposits in the Rural Infrastructure Development Fund (RIDF) and other related deposits have been re-grouped from
investments to other assets. Figures for previous periods have also been re-grouped accordingly.
The above factors were offset, in part, by the following:
The yield on other interest-earning assets increased from 5.20% in scal 2015 to 5.49% in scal 2016 primarily due
to an increase in the yield on RIDF and other related deposits and a decrease in average term money lent from
overseas locations which is low yielding.
Interest on income tax refund was at ` 3.12 billion in scal 2016 (scal 2015: ` 2.71 billion). The receipt, amount
and timing of such income depend on the nature and timing of determinations by tax authorities and are neither
consistent nor predictable.
The cost of funds decreased by 32 basis points from 6.17% in scal 2015 to 5.85% in scal 2016 primarily due to the
following factors:
The cost of average deposits decreased from 6.18% in scal 2015 to 5.88% in scal 2016 primarily due to a decrease
in the cost of term deposits and an increase in proportion of CASA deposits. The cost of term deposits decreased
by 39 basis points from 8.25% in scal 2015 to 7.86% in scal 2016 primarily due to a decrease in cost of domestic
term deposits by 51 basis points from 8.61% in scal 2015 to 8.10% in scal 2016, offset, in part, by a decrease in
the proportion of overseas term deposits in total term deposits. The proportion of average CASA deposits in the
average deposits increased from 39.5% in scal 2015 to 40.7% in scal 2016.
The cost of borrowings decreased by 39 basis points from 6.16% in scal 2015 to 5.77% in scal 2016. The cost of
borrowings decreased primarily due to a decrease in the cost of call and term borrowings, cost of borrowing under
the Liquidity Adjustment Facility of RBI and an increase in foreign currency term borrowings which are lower cost.
While the net interest margin for scal 2016 was 3.49%, the net interest margin for the three months ended March 31,
2016 was 3.37%, reecting primarily the impact of non-accrual of income on the higher level of non-performing assets.
Our interest income, yield on advances, net interest income and net interest margin are likely to continue to be impacted
going forward, due to the increase in non-performing assets, increased proportion of retail advances in total advances
and lending to higher rated corporates.
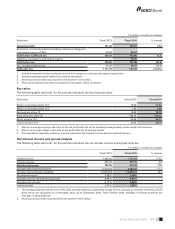
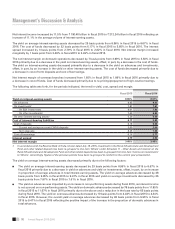
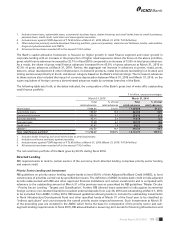
The following table sets forth, for the periods indicated, the trend in average interest-earning assets and average interest-
bearing liabilities:
` in billion, except percentages
Fiscal 2015 Fiscal 2016 % change
Advances ` 3,579.93 ` 4,110.47 14.8%
Interest-earning investments1 1,345.46 1,397.00 3.8
Other interest-earning assets1 551.25 577.36 4.7
Total interest-earning assets 5,476.64 6,084.83 11.1
Deposits 3,285.52 3,665.55 11.6
Borrowings2 1,585.11 1,726.02 8.9
Total interest-bearing liabilities ` 4,870.63 ` 5,391.57 10.7%