ICICI Bank 2016 Annual Report Download - page 106
Download and view the complete annual report
Please find page 106 of the 2016 ICICI Bank annual report below. You can navigate through the pages in the report by either clicking on the pages listed below, or by using the keyword search tool below to find specific information within the annual report.-
 1
1 -
2
-
3
-
4
-
5
-
6
-
7
-
8
-
9
-
10
-
11
-
12
-
13
-
14
-
15
-
16
-
17
-
18
-
19
-
20
-
21
-
22
-
23
-
24
-
25
-
26
-
27
-
28
-
29
-
30
-
31
-
32
-
33
-
34
-
35
-
36
-
37
-
38
-
39
-
40
-
41
-
42
-
43
-
44
-
45
-
46
-
47
-
48
-
49
-
50
-
51
-
52
-
53
-
54
-
55
-
56
-
57
-
58
-
59
-
60
-
61
-
62
-
63
-
64
-
65
-
66
-
67
-
68
-
69
-
70
-
71
-
72
-
73
-
74
-
75
-
76
-
77
-
78
-
79
-
80
-
81
-
82
-
83
-
84
-
85
-
86
-
87
-
88
-
89
-
90
-
91
-
92
-
93
-
94
-
95
-
 96
96 -
 97
97 -
 98
98 -
 99
99 -
 100
100 -
 101
101 -
 102
102 -
 103
103 -
 104
104 -
 105
105 -
 106
106 -
 107
107 -
 108
108 -
 109
109 -
 110
110 -
 111
111 -
 112
112 -
 113
113 -
 114
114 -
 115
115 -
 116
116 -
117
-
118
-
119
-
120
-
121
-
122
-
123
-
124
-
125
-
126
-
127
-
128
-
129
-
130
-
131
-
132
-
133
-
134
-
135
-
136
-
137
-
138
-
139
-
140
-
141
-
142
-
143
-
144
-
145
-
146
-
147
-
148
-
149
-
150
-
151
-
152
-
153
-
154
-
155
-
156
-
157
-
158
-
159
-
160
-
161
-
162
-
163
-
164
-
165
-
166
-
167
-
168
-
169
-
170
-
171
-
172
-
173
-
174
-
175
-
176
-
177
-
178
-
179
-
180
-
181
-
182
-
183
-
184
-
185
-
186
-
187
-
188
-
189
-
190
-
191
-
192
-
193
-
194
-
195
-
196
-
197
-
198
-
199
-
200
-
201
-
202
-
203
-
204
-
205
-
206
-
207
-
208
-
209
-
210
-
211
-
212
-
213
-
214
-
215
-
216
-
217
-
218
-
219
-
220
-
221
-
222
-
223
-
224
-
225
-
226
-
227
-
228
-
229
-
230
-
231
-
232
-
233
-
234
-
235
-
236
-
237
-
238
-
239
-
240
-
241
-
242
-
243
-
244
-
245
-
246
-
247
-
248
-
249
-
250
-
251
-
252
 |
 |

104
Management’s Discussion & Analysis
Annual Report 2015-2016
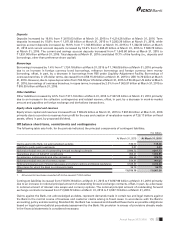
Investments
Total investments increased by 1.4% from ` 1,581.29 billion at March 31, 2015 to ` 1,604.12 billion at March 31, 2016
primarily due to an increase in investments in government securities by ` 50.38 billion, commercial paper by ` 18.91 billion
and pass through certicates by ` 10.64 billion, offset, in part, by a decrease in investments in bonds and debentures by
` 23.08 billion. At March 31, 2016, the Bank had an outstanding net investment of ` 7.91 billion in security receipts
including application money issued by asset reconstruction companies compared to ` 8.41 billion at March 31, 2015.
Advances
Net advances increased by 12.3% from ` 3,875.22 billion at March 31, 2015 to ` 4,352.64 billion at March 31, 2016
primarily due to an increase in domestic advances. Domestic advances increased by 16.4% from ` 2,934.02 billion at
March 31, 2015 to ` 3,414.52 billion at March 31, 2016. Net advances of overseas branches, in US dollar terms, decreased
from US$ 15.1 billion at March 31, 2015 to US$ 14.2 billion at March 31, 2016. However, due to rupee depreciation from
` 62.50 per US dollar at March 31, 2015 to ` 66.26 per US dollar at March 31, 2016, the decrease in rupee terms was lower,
from ` 941.20 billion at March 31, 2015 to ` 938.12 billion at March 31, 2016.
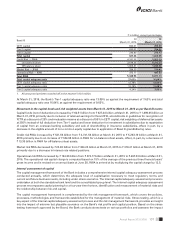
Fixed and other assets
Fixed assets (net block) increased by 60.3% from ` 47.26 billion at March 31, 2015 to ` 75.76 billion at March 31, 2016
primarily due to revaluation of premises by ` 28.17 billion. Other assets increased from ` 534.48 billion at March 31, 2015
to ` 575.74 billion at March 31, 2016 primarily due to an increase in deferred tax assets and non-banking assets acquired in
satisfaction of claims, offset, in part, by a decrease in mark-to-market and receivables on foreign exchange and derivative
transactions. RIDF and other related deposits made in lieu of shortfall in directed lending requirements decreased from
` 284.51 billion at March 31, 2015 to ` 280.66 billion at March 31, 2016. During scal 2016, the Bank acquired xed assets
amounting to ` 17.22 billion in satisfaction of claims under debt-asset swap transactions with certain borrowers.
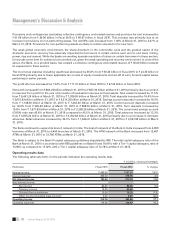
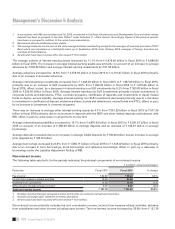
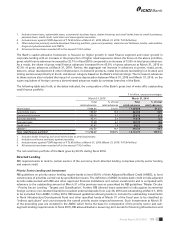
Liabilities
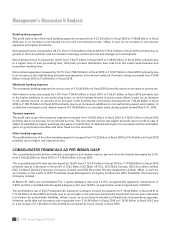
The following table sets forth, at the dates indicated, the principal components of liabilities (including capital and reserves).
` in billion, except percentages
Liabilities At March 31, 2015 At March 31, 2016 % change
Equity share capital ` 11.60 ` 11.70 0.9%
Reserves 792.69 885.66 11.7
Deposits 3,615.63 4,214.26 16.6
- Savings deposits 1,148.60 1,342.30 16.9
- Current deposits 495.20 588.70 18.9
- Term deposits 1,971.83 2,283.26 15.8
Borrowings (excluding subordinated debt and preference share capital) 1,315.29 1,363.66 3.7
- Domestic 456.29 426.39 (6.6)
- Overseas branches 859.00 937.27 9.1
Subordinated debt (included in Tier-1 and Tier-2 capital) 405.39 380.92 (6.0)
- Domestic 384.16 358.40 (6.7)
- Overseas branches 21.23 22.52 6.1
Preference share capital1 3.50 3.50 0.0
Other liabilities 317.19 347.25 9.5
Total liabilities ` 6,461.29 ` 7,206.95 11.5%
1. Included in Schedule 4 - ‘Borrowings’ of the balance sheet.
2. All amounts have been rounded off to the nearest ` 10.0 million.
Total liabilities (including capital and reserves) increased by 11.5% from ` 6,461.29 billion at March 31, 2015 to ` 7,206.95
billion at March 31, 2016 primarily due to 16.6% increase in deposits and 1.4% increase in borrowings.