ICICI Bank 2016 Annual Report Download - page 148
Download and view the complete annual report
Please find page 148 of the 2016 ICICI Bank annual report below. You can navigate through the pages in the report by either clicking on the pages listed below, or by using the keyword search tool below to find specific information within the annual report.-
 1
1 -
2
-
3
-
4
-
5
-
6
-
7
-
8
-
9
-
10
-
11
-
12
-
13
-
14
-
15
-
16
-
17
-
18
-
19
-
20
-
21
-
22
-
23
-
24
-
25
-
26
-
27
-
28
-
29
-
30
-
31
-
32
-
33
-
34
-
35
-
36
-
37
-
38
-
39
-
40
-
41
-
42
-
43
-
44
-
45
-
46
-
47
-
48
-
49
-
50
-
51
-
52
-
53
-
54
-
55
-
56
-
57
-
58
-
59
-
60
-
61
-
62
-
63
-
64
-
65
-
66
-
67
-
68
-
69
-
70
-
71
-
72
-
73
-
74
-
75
-
76
-
77
-
78
-
79
-
80
-
81
-
82
-
83
-
84
-
85
-
86
-
87
-
88
-
89
-
90
-
91
-
92
-
93
-
94
-
95
-
96
-
97
-
98
-
99
-
100
-
101
-
102
-
103
-
104
-
105
-
106
-
107
-
108
-
109
-
110
-
111
-
112
-
113
-
114
-
115
-
116
-
117
-
118
-
119
-
120
-
121
-
122
-
123
-
124
-
125
-
126
-
127
-
128
-
129
-
130
-
131
-
132
-
133
-
134
-
135
-
136
-
137
-
 138
138 -
 139
139 -
 140
140 -
 141
141 -
 142
142 -
 143
143 -
 144
144 -
 145
145 -
 146
146 -
 147
147 -
 148
148 -
 149
149 -
 150
150 -
 151
151 -
 152
152 -
 153
153 -
 154
154 -
 155
155 -
 156
156 -
 157
157 -
 158
158 -
159
-
160
-
161
-
162
-
163
-
164
-
165
-
166
-
167
-
168
-
169
-
170
-
171
-
172
-
173
-
174
-
175
-
176
-
177
-
178
-
179
-
180
-
181
-
182
-
183
-
184
-
185
-
186
-
187
-
188
-
189
-
190
-
191
-
192
-
193
-
194
-
195
-
196
-
197
-
198
-
199
-
200
-
201
-
202
-
203
-
204
-
205
-
206
-
207
-
208
-
209
-
210
-
211
-
212
-
213
-
214
-
215
-
216
-
217
-
218
-
219
-
220
-
221
-
222
-
223
-
224
-
225
-
226
-
227
-
228
-
229
-
230
-
231
-
232
-
233
-
234
-
235
-
236
-
237
-
238
-
239
-
240
-
241
-
242
-
243
-
244
-
245
-
246
-
247
-
248
-
249
-
250
-
251
-
252
 |
 |

Annual Report 2015-2016146
Schedules
forming part of the Accounts (Contd.)
Financial Statements of ICICI Bank Limited
The Bank during the three months ended March 31, 2016 maintained average HQLA (after haircut) of ` 657,810.1
million (March 31, 2015: ` 569,153.4 million) against the average liquidity requirement of ` 502,575.6 million (March
31, 2015: ` 336,609.6 million) at minimum LCR requirement of 70%. HQLA primarily included government securities
in excess of minimum statutory liquidity ratio (SLR) and to the extent allowed under marginal standing facility (MSF)
and facility to avail liquidity for LCR (FALLCR) of ` 498,952.5 million (March 31, 2015: ` 405,228.9 million). Additionally,
cash, balance in excess of cash reserve requirement with RBI and the Central banks of countries where Bank’s
branches are located amounting to ` 104,655.2 million (March 31, 2015: ` 119,941.0 million),. Further, average level 2
assets primarily consisting of AA- and above rated corporate bonds and commercial papers amounted to ` 33,334.1
million (March 31, 2015: ` 29,028.0 million).
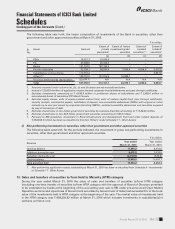
At March 31, 2016, top liability products/instruments and their percentage contribution to the total liabilities of the Bank
were saving account deposits 18.63% (March 31, 2015: 17.78%), term deposits 31.68% (March 31, 2015: 30.52%), bond
borrowings 12.81% (March 31, 2015: 13.83%) and current account deposits 8.17% (March 31, 2015: 7.66%). Top 20
depositors constituted 7.35% (March 31, 2015: 6.43%) of total deposits of the Bank at March 31, 2016. Further, the total
borrowings mobilised from signicant counterparties (from whom, the funds borrowed were more than 1.00% of the
Bank’s total liabilities), were 11.81% (March 31, 2015: 13.66%) of the total liabilities of the Bank at March 31, 2016.
The weighted cash outows are primarily driven by unsecured wholesale funding which includes operational
deposits, non-operational deposits and unsecured debt. During Q4-2016, unsecured wholesale funding contributed
59.50% (March 31, 2015: 50.19%) of the total weighted cash outows. The non-operational deposits include term
deposits with premature withdrawal facility. Retail deposits including deposits from small business customers and
other contingent funding obligations contributed 20.89% (March 31, 2015: 24.58%) and 7.50% (March 31, 2015:
12.37%) of the total weighted cash outows respectively. The other contingent funding obligations primarily include
bank guarantees (BGs) and letters of credit (LCs) issued on behalf of the Bank’s clients.
Liquidity requirement of the Bank on account of market valuation changes for derivative transactions was limited as
the Bank has not executed any Credit Support Annex (CSA) requiring it to post collateral for derivative transactions.
However, the Bank may be required to post additional collateral due to market valuation changes on derivative
transactions settled through Clearing Corporation of India (CCIL) which is a Qualied Central Counterparty (QCCP)
in India including the Clearing Corporation of India (CCIL). The outow on account of market valuation change for
derivative transactions with QCCPs has been considered based on the prescribed look back approach.
Based on the above, monthly average LCR of the Bank for the three months ended March 31, 2016 was 91.62% (March 31,
2015: 101.45%). During the three months ended on March 31, 2016, other than Indian Rupee, USD was the only signicant
foreign currency which constituted more than 5.00% of the balance sheet size of the Bank. Average LCR of the Bank for
USD currency was 87.90% (March 31, 2015: 100.83%) for the three months ended March 31, 2016.
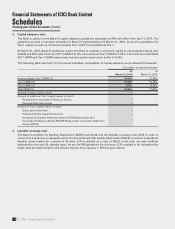
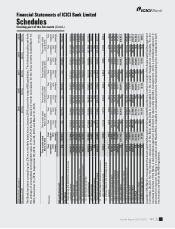
5. Information about business and geographical segments
Business Segments
Pursuant to the guidelines issued by RBI on AS 17 - Segment Reporting - Enhancement of Disclosures dated April 18,
2007, effective from year ended March 31, 2008, the following business segments have been reported.
Retail Banking includes exposures which satisfy the four criteria of orientation, product, granularity and low
value of individual exposures for retail exposures laid down in BCBS document “International Convergence of
Capital Measurement and Capital Standards: A Revised Framework”.
Wholesale Banking includes all advances to trusts, partnership rms, companies and statutory bodies, which are
not included under Retail Banking.
Treasury includes the entire investment and derivative portfolio of the Bank.
Other Banking includes leasing operations and other items not attributable to any particular business segment.
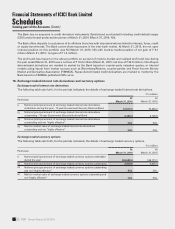
Income, expenses, assets and liabilities are either specically identied with individual segments or are allocated to
segments on a systematic basis.
All liabilities are transfer priced to a central treasury unit, which pools all funds and lends to the business units at appropriate
rates based on the relevant maturity of assets being funded after adjusting for regulatory reserve requirements.
The transfer pricing mechanism of the Bank is periodically reviewed. The segment results are determined based on
the transfer pricing mechanism prevailing for the respective reporting periods.