ICICI Bank 2016 Annual Report Download - page 157
Download and view the complete annual report
Please find page 157 of the 2016 ICICI Bank annual report below. You can navigate through the pages in the report by either clicking on the pages listed below, or by using the keyword search tool below to find specific information within the annual report.-
 1
1 -
2
-
3
-
4
-
5
-
6
-
7
-
8
-
9
-
10
-
11
-
12
-
13
-
14
-
15
-
16
-
17
-
18
-
19
-
20
-
21
-
22
-
23
-
24
-
25
-
26
-
27
-
28
-
29
-
30
-
31
-
32
-
33
-
34
-
35
-
36
-
37
-
38
-
39
-
40
-
41
-
42
-
43
-
44
-
45
-
46
-
47
-
48
-
49
-
50
-
51
-
52
-
53
-
54
-
55
-
56
-
57
-
58
-
59
-
60
-
61
-
62
-
63
-
64
-
65
-
66
-
67
-
68
-
69
-
70
-
71
-
72
-
73
-
74
-
75
-
76
-
77
-
78
-
79
-
80
-
81
-
82
-
83
-
84
-
85
-
86
-
87
-
88
-
89
-
90
-
91
-
92
-
93
-
94
-
95
-
96
-
97
-
98
-
99
-
100
-
101
-
102
-
103
-
104
-
105
-
106
-
107
-
108
-
109
-
110
-
111
-
112
-
113
-
114
-
115
-
116
-
117
-
118
-
119
-
120
-
121
-
122
-
123
-
124
-
125
-
126
-
127
-
128
-
129
-
130
-
131
-
132
-
133
-
134
-
135
-
136
-
137
-
138
-
139
-
140
-
141
-
142
-
143
-
144
-
145
-
146
-
 147
147 -
 148
148 -
 149
149 -
 150
150 -
 151
151 -
 152
152 -
 153
153 -
 154
154 -
 155
155 -
 156
156 -
 157
157 -
 158
158 -
 159
159 -
 160
160 -
 161
161 -
 162
162 -
 163
163 -
 164
164 -
 165
165 -
 166
166 -
 167
167 -
168
-
169
-
170
-
171
-
172
-
173
-
174
-
175
-
176
-
177
-
178
-
179
-
180
-
181
-
182
-
183
-
184
-
185
-
186
-
187
-
188
-
189
-
190
-
191
-
192
-
193
-
194
-
195
-
196
-
197
-
198
-
199
-
200
-
201
-
202
-
203
-
204
-
205
-
206
-
207
-
208
-
209
-
210
-
211
-
212
-
213
-
214
-
215
-
216
-
217
-
218
-
219
-
220
-
221
-
222
-
223
-
224
-
225
-
226
-
227
-
228
-
229
-
230
-
231
-
232
-
233
-
234
-
235
-
236
-
237
-
238
-
239
-
240
-
241
-
242
-
243
-
244
-
245
-
246
-
247
-
248
-
249
-
250
-
251
-
252
 |
 |

Annual Report 2015-2016 155
Schedules
forming part of the Accounts (Contd.)
Financial Statements of ICICI Bank Limited
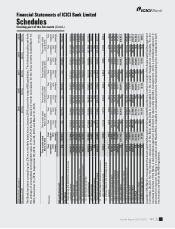
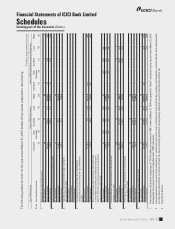
The following table sets forth, for the period indicated, the details of derivative positions.
` in million
Sr.
No. Particulars
At March 31, 2016 At March 31, 2015
Currency
derivative1
Interest rate
derivative2
Currency
derivative1
Interest rate
derivative2
1 Derivatives (Notional principal amount)
a) For hedging 13,895.2 565,237.3 23,695.3 463,792.9
b) For trading 946,749.3 2,348,522.6 1,027,190.7 2,537,928.1
2 Marked to market positions3
a) Asset (+) 35,782.6 16,697.9 43,892.8 17,658.3
b) Liability (-) (33,844.0) (17,159.2) (43,608.8) (19,957.6)
3 Credit exposure4 86,084.6 62,874.1 99,796.9 65,281.4
4Likely impact of one percentage change in interest
rate (100*PV01)5
a) On hedging derivatives6 96.9 16,621.7 218.1 14,423.4
b) On trading derivatives 1,380.5 1,076.2 1,027.8 694.3
5Maximum and minimum of 100*PV01 observed
during the period
a) On hedging6
Maximum 228.0 16,960.1 345.4 15,651.1
Minimum 93.7 12,732.7 172.3 13,067.2
b) On trading
Maximum 1,730.8 1,708.6 1,080.8 832.8
Minimum 962.4 88.4 714.7 73.9
1. Exchange traded and Over the Counter (OTC) options, cross currency interest rate swaps and currency futures are included in
currency derivatives.
2. Interest rate swaps, forward rate agreements, swaptions and exchange traded interest rate derivatives are included in interest
rate derivatives.
3. For trading portfolio including accrued interest.
4. Includes accrued interest and has been computed based on Current Exposure method.
5. Amounts given are absolute values on a net basis, excluding options.
6. The swap contracts entered into for hedging purpose would have an opposite and off-setting impact with the underlying on-
balance sheet items.
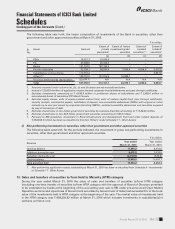
The following tables set forth, for the periods indicated, the details of forex contracts.
` in million
Sr.
No. Particulars At March 31, 2016 At March 31, 2015
Trading Non-trading Trading Non-trading
1Forex contracts (Notional principal amount) 3,048,537.0 519,192.1 2,380,384.1 518,340.9
2 Marked to market positions
a) Asset (+) 16,659.3 3,563.5 22,585.2 3,660.1
b) Liability (-) (14,362.8) (5,775.9) (19,159.2) (5,425.4)
3 Credit exposure1 102,000.4 11,278.1 84,003.9 13,116.0
4Likely impact of one percentage change in interest rate
(100*PV01)2 28.2 88.2 23.5 189.1
1. Computed based on current exposure method.
2. Amounts given are absolute values on a net basis.
The net overnight open position at March 31, 2016 was ` 1,272.1 million (March 31, 2015: ` 1,193.1 million).