ICICI Bank 2016 Annual Report Download - page 170
Download and view the complete annual report
Please find page 170 of the 2016 ICICI Bank annual report below. You can navigate through the pages in the report by either clicking on the pages listed below, or by using the keyword search tool below to find specific information within the annual report.-
 1
1 -
2
-
3
-
4
-
5
-
6
-
7
-
8
-
9
-
10
-
11
-
12
-
13
-
14
-
15
-
16
-
17
-
18
-
19
-
20
-
21
-
22
-
23
-
24
-
25
-
26
-
27
-
28
-
29
-
30
-
31
-
32
-
33
-
34
-
35
-
36
-
37
-
38
-
39
-
40
-
41
-
42
-
43
-
44
-
45
-
46
-
47
-
48
-
49
-
50
-
51
-
52
-
53
-
54
-
55
-
56
-
57
-
58
-
59
-
60
-
61
-
62
-
63
-
64
-
65
-
66
-
67
-
68
-
69
-
70
-
71
-
72
-
73
-
74
-
75
-
76
-
77
-
78
-
79
-
80
-
81
-
82
-
83
-
84
-
85
-
86
-
87
-
88
-
89
-
90
-
91
-
92
-
93
-
94
-
95
-
96
-
97
-
98
-
99
-
100
-
101
-
102
-
103
-
104
-
105
-
106
-
107
-
108
-
109
-
110
-
111
-
112
-
113
-
114
-
115
-
116
-
117
-
118
-
119
-
120
-
121
-
122
-
123
-
124
-
125
-
126
-
127
-
128
-
129
-
130
-
131
-
132
-
133
-
134
-
135
-
136
-
137
-
138
-
139
-
140
-
141
-
142
-
143
-
144
-
145
-
146
-
147
-
148
-
149
-
150
-
151
-
152
-
153
-
154
-
155
-
156
-
157
-
158
-
159
-
 160
160 -
 161
161 -
 162
162 -
 163
163 -
 164
164 -
 165
165 -
 166
166 -
 167
167 -
 168
168 -
 169
169 -
 170
170 -
 171
171 -
 172
172 -
 173
173 -
 174
174 -
 175
175 -
 176
176 -
 177
177 -
 178
178 -
 179
179 -
 180
180 -
181
-
182
-
183
-
184
-
185
-
186
-
187
-
188
-
189
-
190
-
191
-
192
-
193
-
194
-
195
-
196
-
197
-
198
-
199
-
200
-
201
-
202
-
203
-
204
-
205
-
206
-
207
-
208
-
209
-
210
-
211
-
212
-
213
-
214
-
215
-
216
-
217
-
218
-
219
-
220
-
221
-
222
-
223
-
224
-
225
-
226
-
227
-
228
-
229
-
230
-
231
-
232
-
233
-
234
-
235
-
236
-
237
-
238
-
239
-
240
-
241
-
242
-
243
-
244
-
245
-
246
-
247
-
248
-
249
-
250
-
251
-
252
 |
 |
Annual Report 2015-2016168
Schedules
forming part of the Accounts (Contd.)
Financial Statements of ICICI Bank Limited
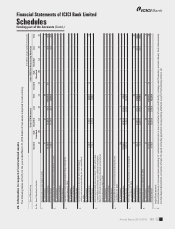
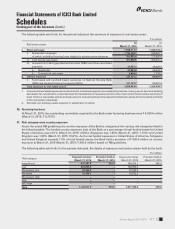
(II) Sector-wise Advances
` in million except percentages
At March 31, 2016
Sr.
no. Sector Outstanding
advances Gross NPAs
% of gross NPAs to
total advances in
that sector
A. Priority sector
1. Agriculture and allied activities 292,270.1 9,202.6 3.15%
2. Advances to industries sector eligible as priority
sector lending 149,124.4 4,900.5 3.29%
3. Services of which: 136,508.0 2,662.8 1.95%
Transport operators 76,455.8 1,196.3 1.56%
Wholesale Trade 17,211.9 447.6 2.60%
4. Personal loans of which: 359,514.1 4,271.8 1.19%
Housing 241,865.6 2,311.0 0.96%
Vehicle loans 106,321.8 1,739.4 1.64%
Sub-total (A) 937,416.6 21,037.7 2.24%
B. Non-priority sector
1. Agriculture and allied activities – – –
2. Advances to industries sector of which: 1,639,731.6 168,177.6 10.26%
Infrastructure 541,521.9 41,917.4 7.74%
Basic metal and metal products 354,484.0 66,141.6 18.66%
3. Services of which: 872,035.5 62,393.3 7.15%
Commercial real estate 268,848.6 5,568.0 2.07%
Wholesale Trade 137,418.0 6,018.5 4.38%
4. Personal loans1, of which: 1,052,641.9 10,603.8 1.01%
Housing 745,402.6 4,157.4 0.56%
Sub-total (B) 3,564,409.0 241,174.7 6.77%
Total (A+B) 4,501,825.6 262,212.4 5.82%
1. Excludes commercial business loans and dealer funding.
2. Sub-sectors have been disclosed where advances exceed 10% of total advances in that sector at reporting date.
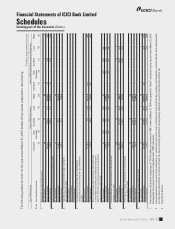
` in million except percentages
At March 31, 2015
Sr.
no. Sector Outstanding
advances Gross NPAs
% of gross NPAs to
total advances in
that sector
A. Priority sector
1. Agriculture and allied activities 237,737.6 7,051.4 2.97%
2. Advances to industries sector eligible as priority sector
lending 114,316.8 3,660.3 3.20%
3. Services of which: 118,499.0 1,963.1 1.66%
Transport operators 61,484.7 1,273.5 2.07%
Wholesale Trade 14,487.1 487.7 3.37%
4. Personal loans of which: 301,750.1 3,818.1 1.27%
Housing 217,485.4 2,571.4 1.18%
Vehicle loans 78,868.5 967.2 1.23%
Sub-total (A) 772,303.5 16,492.9 2.14%