ICICI Bank 2016 Annual Report Download - page 166
Download and view the complete annual report
Please find page 166 of the 2016 ICICI Bank annual report below. You can navigate through the pages in the report by either clicking on the pages listed below, or by using the keyword search tool below to find specific information within the annual report.-
 1
1 -
2
-
3
-
4
-
5
-
6
-
7
-
8
-
9
-
10
-
11
-
12
-
13
-
14
-
15
-
16
-
17
-
18
-
19
-
20
-
21
-
22
-
23
-
24
-
25
-
26
-
27
-
28
-
29
-
30
-
31
-
32
-
33
-
34
-
35
-
36
-
37
-
38
-
39
-
40
-
41
-
42
-
43
-
44
-
45
-
46
-
47
-
48
-
49
-
50
-
51
-
52
-
53
-
54
-
55
-
56
-
57
-
58
-
59
-
60
-
61
-
62
-
63
-
64
-
65
-
66
-
67
-
68
-
69
-
70
-
71
-
72
-
73
-
74
-
75
-
76
-
77
-
78
-
79
-
80
-
81
-
82
-
83
-
84
-
85
-
86
-
87
-
88
-
89
-
90
-
91
-
92
-
93
-
94
-
95
-
96
-
97
-
98
-
99
-
100
-
101
-
102
-
103
-
104
-
105
-
106
-
107
-
108
-
109
-
110
-
111
-
112
-
113
-
114
-
115
-
116
-
117
-
118
-
119
-
120
-
121
-
122
-
123
-
124
-
125
-
126
-
127
-
128
-
129
-
130
-
131
-
132
-
133
-
134
-
135
-
136
-
137
-
138
-
139
-
140
-
141
-
142
-
143
-
144
-
145
-
146
-
147
-
148
-
149
-
150
-
151
-
152
-
153
-
154
-
155
-
 156
156 -
 157
157 -
 158
158 -
 159
159 -
 160
160 -
 161
161 -
 162
162 -
 163
163 -
 164
164 -
 165
165 -
 166
166 -
 167
167 -
 168
168 -
 169
169 -
 170
170 -
 171
171 -
 172
172 -
 173
173 -
 174
174 -
 175
175 -
 176
176 -
177
-
178
-
179
-
180
-
181
-
182
-
183
-
184
-
185
-
186
-
187
-
188
-
189
-
190
-
191
-
192
-
193
-
194
-
195
-
196
-
197
-
198
-
199
-
200
-
201
-
202
-
203
-
204
-
205
-
206
-
207
-
208
-
209
-
210
-
211
-
212
-
213
-
214
-
215
-
216
-
217
-
218
-
219
-
220
-
221
-
222
-
223
-
224
-
225
-
226
-
227
-
228
-
229
-
230
-
231
-
232
-
233
-
234
-
235
-
236
-
237
-
238
-
239
-
240
-
241
-
242
-
243
-
244
-
245
-
246
-
247
-
248
-
249
-
250
-
251
-
252
 |
 |
Annual Report 2015-2016164
Schedules
forming part of the Accounts (Contd.)
Financial Statements of ICICI Bank Limited
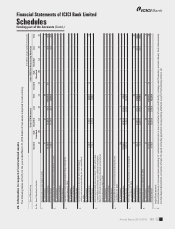
` in million, except number of accounts
Type of Restructuring
Others Total
Sr. No. Asset Classication Details
Standard
(a)
Sub-
Standard
(b)
Doubtful
(c)
Loss
(d)
Total
(e)
Standard
(a)
Sub-
Standard
(b)
Doubtful
(c)
Loss
(d)
Total
(e)
1. Restructured accounts at April 1, 2015
No. of borrowers 1,204 20 34 138 1,396 1,256 20 55 141 1,472
Amount outstanding 38,723.9 3,652.5 13,490.0 2,298.9 58,165.3 119,460.4 3,652.5 51,328.5 2,768.5 177,209.9
Provision thereon 1,642.1 925.5 7,794.2 2,298.9 12,660.7 9,287.1 925.5 24,564.2 2,768.5 37,545.3
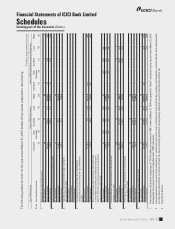
2. Fresh restructuring during the year ended March 31, 2016
No. of borrowers 9 –––99–––9
Amount outstanding 23,070.5 –––23,070.5 23,070.5 –––23,070.5
Provision thereon 1,201.3 –––1,201.3 1,201.3 –––1,201.3
3. Upgradations to restructured standard category during the
year ended March 31, 2016
No. of borrowers 18 (5) (4) (9) –18 (5) (4) (9) –
Amount outstanding 18.4 (1.6) (6.9) (11.1) (1.2) 18.4 (1.6) (6.9) (11.1) (1.2)
Provision thereon 0.3 (0.3) (6.1) (11.1) (17.2) 0.3 (0.3) (6.1) (11.1) (17.2)
4. Increase/(Decrease) in borrower level outstanding of
existing restructured cases during the year ended March
31, 2016
1
No. of borrowers – – – – –– – – – –
Amount outstanding 3,064.5 0.1 (40.6) (33.3) 2,990.7 6,402.1 0.1 4,663.1 (33.3) 11,030.2
Provision thereon 510.5 –1,677.7 (33.3) 2,154.9 336.4 –9,851.5 (33.3) 10,154.6
5. Restructured standard advances at April 1, 2015, which cease
to attract higher provisioning and/or additional risk weight at
March 31, 2016 and hence need not be shown as restructured
standard advances at April 1, 2016
No. of borrowers (1) –––(1) (1) –––(1)
Amount outstanding (78.1) –––(78.1) (78.1) –––(78.1)
Provision thereon – – – – –– – – – –
6. Downgradations of restructured accounts during the year
ended March 31, 2016
No. of borrowers (764) 725 26 13 –(782) 725 38 14 –
Amount outstanding (25,634.2) (3,039.4) 21,406.7 6,004.3 (1,262.6) (53,002.2) (3,039.4) 47,368.5 8,020.8 (652.3)
Provision thereon (614.6) (823.0) 6,990.4 6,004.3 11,557.1 (3,406.4) (823.0) 21,883.4 8,020.8 25,674.8
7. Write-offs/recovery/sale of restructured accounts during the
year ended March 31, 2016
No. of borrowers (75) (1) (7) (22) (105) (76) (1) (14) (24) (115)
Amount outstanding (2,697.5) (0.2) (1,517.3) (1,614.8) (5,829.8) (2,740.7) (0.2) (8,104.3) (2,065.2) (12,910.4)
Provision thereon (14.9) –(1,514.1) (1,614.8) (3,143.8) (16.0) –(5,826.1) (2,065.2) (7,907.3)
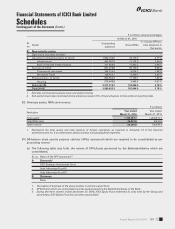
8. Restructured Accounts at March 31, 2016
No. of borrowers 391 739 49 120 1,299 424 739 75 127 1,365
Amount outstanding 36,467.5 611.4 33,331.9 6,644.0 77,054.8 93,130.4 611.4 95,248.9.1 8,679.8 197,670.5
Provision thereon 2,724.7 102.3 14,942.1 6,644.0 24,413.1 7,402.7 102.3 50,466.9 8,679.8 66,651.7
1. Increase/(decrease) in borrower level outstanding of restructured accounts is due to utilisation of cash credit facility, exchange rate fluctuation, accrued interest, fresh disbursement,
non-fund based devolvement, conversion of loans into equity (including application pending allotment) as part of restructuring scheme, etc.
2. “Others” mechanism also include cases restructured under Joint Lender Forum (JLF) mechanism.