ICICI Bank 2016 Annual Report Download - page 42
Download and view the complete annual report
Please find page 42 of the 2016 ICICI Bank annual report below. You can navigate through the pages in the report by either clicking on the pages listed below, or by using the keyword search tool below to find specific information within the annual report.-
 1
1 -
2
-
3
-
4
-
5
-
6
-
7
-
8
-
9
-
10
-
11
-
12
-
13
-
14
-
15
-
16
-
17
-
18
-
19
-
20
-
21
-
22
-
23
-
24
-
25
-
26
-
27
-
28
-
29
-
30
-
31
-
 32
32 -
 33
33 -
 34
34 -
 35
35 -
 36
36 -
 37
37 -
 38
38 -
 39
39 -
 40
40 -
 41
41 -
 42
42 -
 43
43 -
 44
44 -
 45
45 -
 46
46 -
 47
47 -
 48
48 -
 49
49 -
 50
50 -
 51
51 -
 52
52 -
53
-
54
-
55
-
56
-
57
-
58
-
59
-
60
-
61
-
62
-
63
-
64
-
65
-
66
-
67
-
68
-
69
-
70
-
71
-
72
-
73
-
74
-
75
-
76
-
77
-
78
-
79
-
80
-
81
-
82
-
83
-
84
-
85
-
86
-
87
-
88
-
89
-
90
-
91
-
92
-
93
-
94
-
95
-
96
-
97
-
98
-
99
-
100
-
101
-
102
-
103
-
104
-
105
-
106
-
107
-
108
-
109
-
110
-
111
-
112
-
113
-
114
-
115
-
116
-
117
-
118
-
119
-
120
-
121
-
122
-
123
-
124
-
125
-
126
-
127
-
128
-
129
-
130
-
131
-
132
-
133
-
134
-
135
-
136
-
137
-
138
-
139
-
140
-
141
-
142
-
143
-
144
-
145
-
146
-
147
-
148
-
149
-
150
-
151
-
152
-
153
-
154
-
155
-
156
-
157
-
158
-
159
-
160
-
161
-
162
-
163
-
164
-
165
-
166
-
167
-
168
-
169
-
170
-
171
-
172
-
173
-
174
-
175
-
176
-
177
-
178
-
179
-
180
-
181
-
182
-
183
-
184
-
185
-
186
-
187
-
188
-
189
-
190
-
191
-
192
-
193
-
194
-
195
-
196
-
197
-
198
-
199
-
200
-
201
-
202
-
203
-
204
-
205
-
206
-
207
-
208
-
209
-
210
-
211
-
212
-
213
-
214
-
215
-
216
-
217
-
218
-
219
-
220
-
221
-
222
-
223
-
224
-
225
-
226
-
227
-
228
-
229
-
230
-
231
-
232
-
233
-
234
-
235
-
236
-
237
-
238
-
239
-
240
-
241
-
242
-
243
-
244
-
245
-
246
-
247
-
248
-
249
-
250
-
251
-
252
 |
 |

40
Directors’ Report
Annual Report 2015-2016
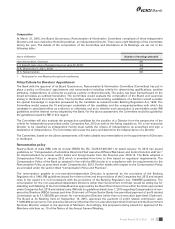
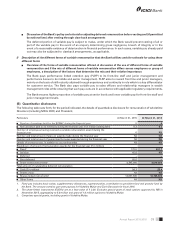
Disclosures required with respect to Section 197(12) of the Companies Act, 2013
The ratio of the remuneration of each Director to the median employee’s remuneration and such other details in terms
of Section 197(12) of the Companies Act, 2013 read with Rule 5 of the Companies (Appointment and Remuneration of
Managerial Personnel) Rules, 2014.
(i) The ratio of the remuneration of each director to the median remuneration of the employees of the company for
the financial year;
Chanda Kochhar, Managing Director & CEO 100:1
N. S. Kannan 67:1
K. Ramkumar 67:1
Vishakha Mulye 67:1
Rajiv Sabharwal 64:1
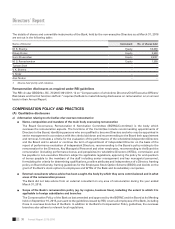
(ii) The percentage increase in remuneration of each director, Chief Financial Officer, Chief Executive Officer, Company
Secretary or Manager, if any, in the financial year;
The percentage increase in remuneration of each Director, Chief Financial Ofcer, Chief Executive Ofcer and Company
Secretary ranged between 12.0% and 15.0%.
(iii) The percentage increase in the median remuneration of employees in the financial year;
The percentage increase in the median remuneration of employees in the nancial year was around 12.0%.
(iv) The number of permanent employees on the rolls of company;
The number of employees, as mentioned in the section on ‘Management’s Discussion & Analysis’ is 74,096. Out of this,
the number of employees on permanent rolls of the company is 72,175, including employees in overseas locations.
(v) The explanation on the relationship between average increase in remuneration and company performance;
The Bank follows prudent remuneration practices under the guidance of the Board and the BGRNC. The Bank’s approach
to remuneration is intended to drive meritocracy within the framework of prudent risk management. Remuneration is
linked to corporate performance, business performance and individual performance.
The Bank has a judicious and prudent approach to compensation and does not use compensation as the sole lever to
attract and retain employees. Employee compensation takes into account a mix of external market pay and internal
equity. The total compensation is a prudent mix of xed pay and variable pay. The proportion of variable pay to total
compensation is higher at senior levels and lower at junior levels.
The increase in remuneration is a function of factors outlined above. The performance of the company has bearing on
the quantum of variable pay declared for employees across levels.
The prot before collective contingency and related reserve and tax was ` 157.96 billion for scal 2016 compared to
` 158.20 billion for scal 2015. The average increase in the remuneration of employees was around 9.0% in scal 2016
compared to 10.0% in scal 2015. Further the senior management of the Bank did not receive performance bonus for
scal 2016. Performance bonus was paid to employees in the grades of Deputy General Manager and below only.
In scal 2016, the weak global economic environment, the sharp downturn in the commodity cycle and the gradual
nature of the domestic economic recovery has adversely impacted the borrowers in certain sectors like iron and steel,
mining, power, rigs and cement. While the banks are working towards resolution of stress on certain borrowers in these
sectors, it may take some time for solutions to be worked out, given the weak operating and recovery environment. In
view of the above, the Bank has on a prudent basis made a collective contingency and related reserve of ` 36.00 billion
towards exposures to these sectors. This is over and above provisions made for non-performing and restructured loans
as per Reserve Bank of India (RBI) guidelines.
In view of the above, the Bank’s prot after tax (PAT) was ` 97.26 billion in FY2016 compared to ` 111.75 billion in FY2015.