ICICI Bank 2016 Annual Report Download - page 230
Download and view the complete annual report
Please find page 230 of the 2016 ICICI Bank annual report below. You can navigate through the pages in the report by either clicking on the pages listed below, or by using the keyword search tool below to find specific information within the annual report.-
 1
1 -
2
-
3
-
4
-
5
-
6
-
7
-
8
-
9
-
10
-
11
-
12
-
13
-
14
-
15
-
16
-
17
-
18
-
19
-
20
-
21
-
22
-
23
-
24
-
25
-
26
-
27
-
28
-
29
-
30
-
31
-
32
-
33
-
34
-
35
-
36
-
37
-
38
-
39
-
40
-
41
-
42
-
43
-
44
-
45
-
46
-
47
-
48
-
49
-
50
-
51
-
52
-
53
-
54
-
55
-
56
-
57
-
58
-
59
-
60
-
61
-
62
-
63
-
64
-
65
-
66
-
67
-
68
-
69
-
70
-
71
-
72
-
73
-
74
-
75
-
76
-
77
-
78
-
79
-
80
-
81
-
82
-
83
-
84
-
85
-
86
-
87
-
88
-
89
-
90
-
91
-
92
-
93
-
94
-
95
-
96
-
97
-
98
-
99
-
100
-
101
-
102
-
103
-
104
-
105
-
106
-
107
-
108
-
109
-
110
-
111
-
112
-
113
-
114
-
115
-
116
-
117
-
118
-
119
-
120
-
121
-
122
-
123
-
124
-
125
-
126
-
127
-
128
-
129
-
130
-
131
-
132
-
133
-
134
-
135
-
136
-
137
-
138
-
139
-
140
-
141
-
142
-
143
-
144
-
145
-
146
-
147
-
148
-
149
-
150
-
151
-
152
-
153
-
154
-
155
-
156
-
157
-
158
-
159
-
160
-
161
-
162
-
163
-
164
-
165
-
166
-
167
-
168
-
169
-
170
-
171
-
172
-
173
-
174
-
175
-
176
-
177
-
178
-
179
-
180
-
181
-
182
-
183
-
184
-
185
-
186
-
187
-
188
-
189
-
190
-
191
-
192
-
193
-
194
-
195
-
196
-
197
-
198
-
199
-
200
-
201
-
202
-
203
-
204
-
205
-
206
-
207
-
208
-
209
-
210
-
211
-
212
-
213
-
214
-
215
-
216
-
217
-
218
-
219
-
 220
220 -
 221
221 -
 222
222 -
 223
223 -
 224
224 -
 225
225 -
 226
226 -
 227
227 -
 228
228 -
 229
229 -
 230
230 -
 231
231 -
 232
232 -
 233
233 -
 234
234 -
 235
235 -
 236
236 -
 237
237 -
 238
238 -
 239
239 -
 240
240 -
241
-
242
-
243
-
244
-
245
-
246
-
247
-
248
-
249
-
250
-
251
-
252
 |
 |

Annual Report 2015-2016228
Schedules
forming part of the Consolidated Accounts (Contd.)
Consolidated Financial Statements
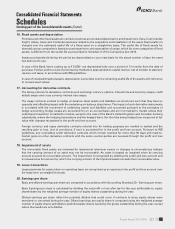
3. Employee Stock Option Scheme (ESOS)
In terms of the ESOS, as amended, the maximum number of options granted to any eligible employee in a nancial
year shall not exceed 0.05% of the issued equity shares of the Bank at the time of grant of the options and aggregate
of all such options granted to the eligible employees shall not exceed 10% of the aggregate number of the issued
equity shares of the Bank on the date(s) of the grant of options. Under the stock option scheme, eligible employees are
entitled to apply for equity shares. Options granted prior to March, 2014, except mentioned below, vest in a graded
manner over a four-year period, with 20%, 20%, 30% and 30% of the grants vesting in each year, commencing
from the end of 12 months from the date of grant. Options granted in April, 2009 vest in a graded manner over a
ve-year period with 20%, 20%, 30% and 30% of grant vesting each year, commencing from the end of 24 months
from the date of grant. Options granted in September, 2011 vest in a graded manner over a ve-years period with
15%, 20%, 20% and 45% of grant vesting each year, commencing from the end of 24 months from the date of the
grant. Options granted after March, 2014 vest in a graded manner over a three-year period with 30%, 30% and 40%
of the grant vesting in each year, commencing from the end of 12 months from the date of grant other than certain
options granted in April 2014 which will vest to the extent of 50% on April 30, 2017 and the balance on April 30,
2018. The options granted in September 2015 will vest to the extent of 50% on April 30, 2018 and 50% on April
30, 2019. However for the options granted in September 2015 if the participant’s employment terminates due to
retirement (including pursuant to any early/voluntary retirement scheme), the whole of the unvested options would
lapse. The options can be exercised within 10 years from the date of grant or ve years from the date of vesting,
whichever is later. The exercise price of Bank’s options, except mentioned below, was the last closing price on the
stock exchange which recorded highest trading volume, one day prior to the date of grant of options. Hence, there
was no compensation cost based on intrinsic value of options.
In February 2011, the Bank granted 15,175,000 options to eligible employees and whole-time Directors of the Bank
and certain of its subsidiaries at an exercise price of ` 193.40. Of these options granted, 50% vested on April 30, 2014
and the balance 50% vested on April 30, 2015. The options can be exercised within 10 years from the date of grant
or ve years from the date of vesting, whichever is later. Based on intrinsic value of options, compensation cost of
` 0.8 million was recognised during the year ended March 31, 2016 (March 31, 2015: ` 16.4 million).
If the Bank had used the fair value of options based on binomial tree model, compensation cost in the year ended
March 31, 2016 would have been higher by ` 3,726.5 million and proforma prot after tax would have been ` 93.54
billion. On a proforma basis, the Bank’s basic and diluted earnings per share would have been ` 16.11 and ` 16.02
respectively. The key assumptions used to estimate the fair value of options granted during the year ended March
31, 2016 are given below.
Risk-free interest rate 7.58% to 8.19%
Expected life 3.16 to 5.78 years
Expected volatility 30.67% to 32.77%
Expected dividend yield 1.62% to 2.11%
The weighted average fair value of options granted during the year ended March 31, 2016 was ` 100.50 (March 31,
2015: ` 90.09).
The following table sets forth, for the periods indicated, the summary of the status of the Bank’s stock option plan.
` except number of options
Particulars
Stock options outstanding
Year ended March 31, 2016 Year ended March 31, 2015
Number
of options
Weighted average
exercise price
Number
of options
Weighted average
exercise price
Outstanding at the beginning of the year 148,433,700 205.02 140,521,765 183.74
Add: Granted during the year 64,904,500 289.28 32,375,500 259.96
Less: Lapsed during the year, net of re-issuance 4,189,850 260.67 1,382,765 235.40
Less: Exercised during the year 17,523,785 161.16 23,080,800 150.66
Outstanding at the end of the year 191,624,565 236.36 148,433,700 205.02
Options exercisable 89,788,515 198.08 75,938,800 180.80