ICICI Bank 2016 Annual Report Download - page 6
Download and view the complete annual report
Please find page 6 of the 2016 ICICI Bank annual report below. You can navigate through the pages in the report by either clicking on the pages listed below, or by using the keyword search tool below to find specific information within the annual report.-
 1
1 -
 2
2 -
 3
3 -
 4
4 -
 5
5 -
 6
6 -
 7
7 -
 8
8 -
 9
9 -
 10
10 -
 11
11 -
 12
12 -
 13
13 -
 14
14 -
 15
15 -
 16
16 -
 17
17 -
18
-
19
-
20
-
21
-
22
-
23
-
24
-
25
-
26
-
27
-
28
-
29
-
30
-
31
-
32
-
33
-
34
-
35
-
36
-
37
-
38
-
39
-
40
-
41
-
42
-
43
-
44
-
45
-
46
-
47
-
48
-
49
-
50
-
51
-
52
-
53
-
54
-
55
-
56
-
57
-
58
-
59
-
60
-
61
-
62
-
63
-
64
-
65
-
66
-
67
-
68
-
69
-
70
-
71
-
72
-
73
-
74
-
75
-
76
-
77
-
78
-
79
-
80
-
81
-
82
-
83
-
84
-
85
-
86
-
87
-
88
-
89
-
90
-
91
-
92
-
93
-
94
-
95
-
96
-
97
-
98
-
99
-
100
-
101
-
102
-
103
-
104
-
105
-
106
-
107
-
108
-
109
-
110
-
111
-
112
-
113
-
114
-
115
-
116
-
117
-
118
-
119
-
120
-
121
-
122
-
123
-
124
-
125
-
126
-
127
-
128
-
129
-
130
-
131
-
132
-
133
-
134
-
135
-
136
-
137
-
138
-
139
-
140
-
141
-
142
-
143
-
144
-
145
-
146
-
147
-
148
-
149
-
150
-
151
-
152
-
153
-
154
-
155
-
156
-
157
-
158
-
159
-
160
-
161
-
162
-
163
-
164
-
165
-
166
-
167
-
168
-
169
-
170
-
171
-
172
-
173
-
174
-
175
-
176
-
177
-
178
-
179
-
180
-
181
-
182
-
183
-
184
-
185
-
186
-
187
-
188
-
189
-
190
-
191
-
192
-
193
-
194
-
195
-
196
-
197
-
198
-
199
-
200
-
201
-
202
-
203
-
204
-
205
-
206
-
207
-
208
-
209
-
210
-
211
-
212
-
213
-
214
-
215
-
216
-
217
-
218
-
219
-
220
-
221
-
222
-
223
-
224
-
225
-
226
-
227
-
228
-
229
-
230
-
231
-
232
-
233
-
234
-
235
-
236
-
237
-
238
-
239
-
240
-
241
-
242
-
243
-
244
-
245
-
246
-
247
-
248
-
249
-
250
-
251
-
252
 |
 |

Annual Report 2015-20164
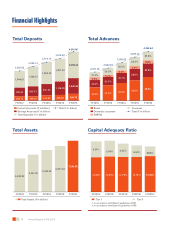
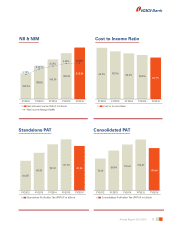
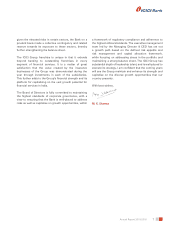
Financial Highlights
Total Assets
Total Assets (` in billion)
4,890.69
5,367.95 5,946.42
6,461.29
7,206.95
FY2012 FY2013 FY2014 FY2016FY2015
Total Deposits
Current Accounts (` in billion)
Savings Accounts (` in billion)
Term Deposits (` in billion)
Total (` in billion)
349.73
760.46
1,444.81
2,555.00
3,319.14
2,926.14
3,615.63
4,214.26
369.26
856.51
432.45
991.33
1,895.36
495.20
1,148.60
1,971.83
FY2012 FY2013 FY2014 FY2016FY2015
1,342.30
588.70
2,283.26
1,700.37
Total Advances
4,352.64
2,537.28
2,902.49
3,387.03
3,875.22
25.3%
24.3%
46.6%
27.5%
21.6%
Retail
Domestic corporate
SMEAG
Overseas
Total (` in billion)
FY2012 FY2013 FY2014 FY2016FY2015
42.5%
28.8%
39.0%
30.1%
26.5%
37.0%
32.5%
38.0%
28.6%
27.4%
4.3%
4.4%
4.4%
5.2%
6.0%
Capital Adequacy Ratio
12.80%
5.94%
5.84%
12.68% 13.09%
3.55%
12.78%
4.24%
12.78%
4.92%
Tier I
FY20121FY20131FY20142FY20162
FY20152
1. In accordance with Basel II guidelines of RBI
2. In accordance with Basel III guidelines of RBI
Tier II