ICICI Bank 2016 Annual Report Download - page 150
Download and view the complete annual report
Please find page 150 of the 2016 ICICI Bank annual report below. You can navigate through the pages in the report by either clicking on the pages listed below, or by using the keyword search tool below to find specific information within the annual report.-
 1
1 -
2
-
3
-
4
-
5
-
6
-
7
-
8
-
9
-
10
-
11
-
12
-
13
-
14
-
15
-
16
-
17
-
18
-
19
-
20
-
21
-
22
-
23
-
24
-
25
-
26
-
27
-
28
-
29
-
30
-
31
-
32
-
33
-
34
-
35
-
36
-
37
-
38
-
39
-
40
-
41
-
42
-
43
-
44
-
45
-
46
-
47
-
48
-
49
-
50
-
51
-
52
-
53
-
54
-
55
-
56
-
57
-
58
-
59
-
60
-
61
-
62
-
63
-
64
-
65
-
66
-
67
-
68
-
69
-
70
-
71
-
72
-
73
-
74
-
75
-
76
-
77
-
78
-
79
-
80
-
81
-
82
-
83
-
84
-
85
-
86
-
87
-
88
-
89
-
90
-
91
-
92
-
93
-
94
-
95
-
96
-
97
-
98
-
99
-
100
-
101
-
102
-
103
-
104
-
105
-
106
-
107
-
108
-
109
-
110
-
111
-
112
-
113
-
114
-
115
-
116
-
117
-
118
-
119
-
120
-
121
-
122
-
123
-
124
-
125
-
126
-
127
-
128
-
129
-
130
-
131
-
132
-
133
-
134
-
135
-
136
-
137
-
138
-
139
-
 140
140 -
 141
141 -
 142
142 -
 143
143 -
 144
144 -
 145
145 -
 146
146 -
 147
147 -
 148
148 -
 149
149 -
 150
150 -
 151
151 -
 152
152 -
 153
153 -
 154
154 -
 155
155 -
 156
156 -
 157
157 -
 158
158 -
 159
159 -
 160
160 -
161
-
162
-
163
-
164
-
165
-
166
-
167
-
168
-
169
-
170
-
171
-
172
-
173
-
174
-
175
-
176
-
177
-
178
-
179
-
180
-
181
-
182
-
183
-
184
-
185
-
186
-
187
-
188
-
189
-
190
-
191
-
192
-
193
-
194
-
195
-
196
-
197
-
198
-
199
-
200
-
201
-
202
-
203
-
204
-
205
-
206
-
207
-
208
-
209
-
210
-
211
-
212
-
213
-
214
-
215
-
216
-
217
-
218
-
219
-
220
-
221
-
222
-
223
-
224
-
225
-
226
-
227
-
228
-
229
-
230
-
231
-
232
-
233
-
234
-
235
-
236
-
237
-
238
-
239
-
240
-
241
-
242
-
243
-
244
-
245
-
246
-
247
-
248
-
249
-
250
-
251
-
252
 |
 |
Annual Report 2015-2016148
Schedules
forming part of the Accounts (Contd.)
Financial Statements of ICICI Bank Limited
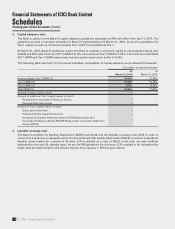
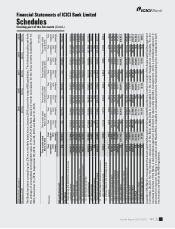
The following table sets forth, for the periods indicated, geographical segment revenues.
` in million
Revenue Year ended
March 31, 2016
Year ended
March 31, 2015
Domestic operations 620,424.0 557,994.4
Foreign operations 60,200.9 54,678.3
Total 680,624.9 612,672.7
The following table sets forth, for the periods indicated, geographical segment assets.
` in million
Assets At
March 31, 2016
At
March 31, 2015
Domestic operations 5,940,663.4 5,210,699.8
Foreign operations 1,188,387.1 1,203,814.7
Total 7,129,050.5 6,414,514.5
Segment assets do not include tax paid in advance/tax deducted at source (net) and deferred tax asset (net).
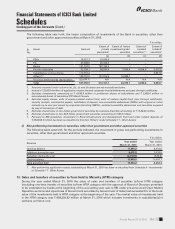
The following table sets forth, for the periods indicated, capital expenditure and depreciation thereon for the
geographical segments.
` in million
Capital expenditure
incurred during
Depreciation
provided during
Year ended
March 31, 2016
Year ended
March 31, 2015
Year ended
March 31, 2016
Year ended
March 31, 2015
Domestic operations 7,331.5 7,203.7 6,916.9 6,539.1
Foreign operations 125.7 65.8 68.2 50.4
Total 7,457.2 7,269.5 6,985.1 6,589.5
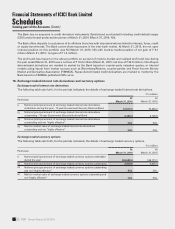
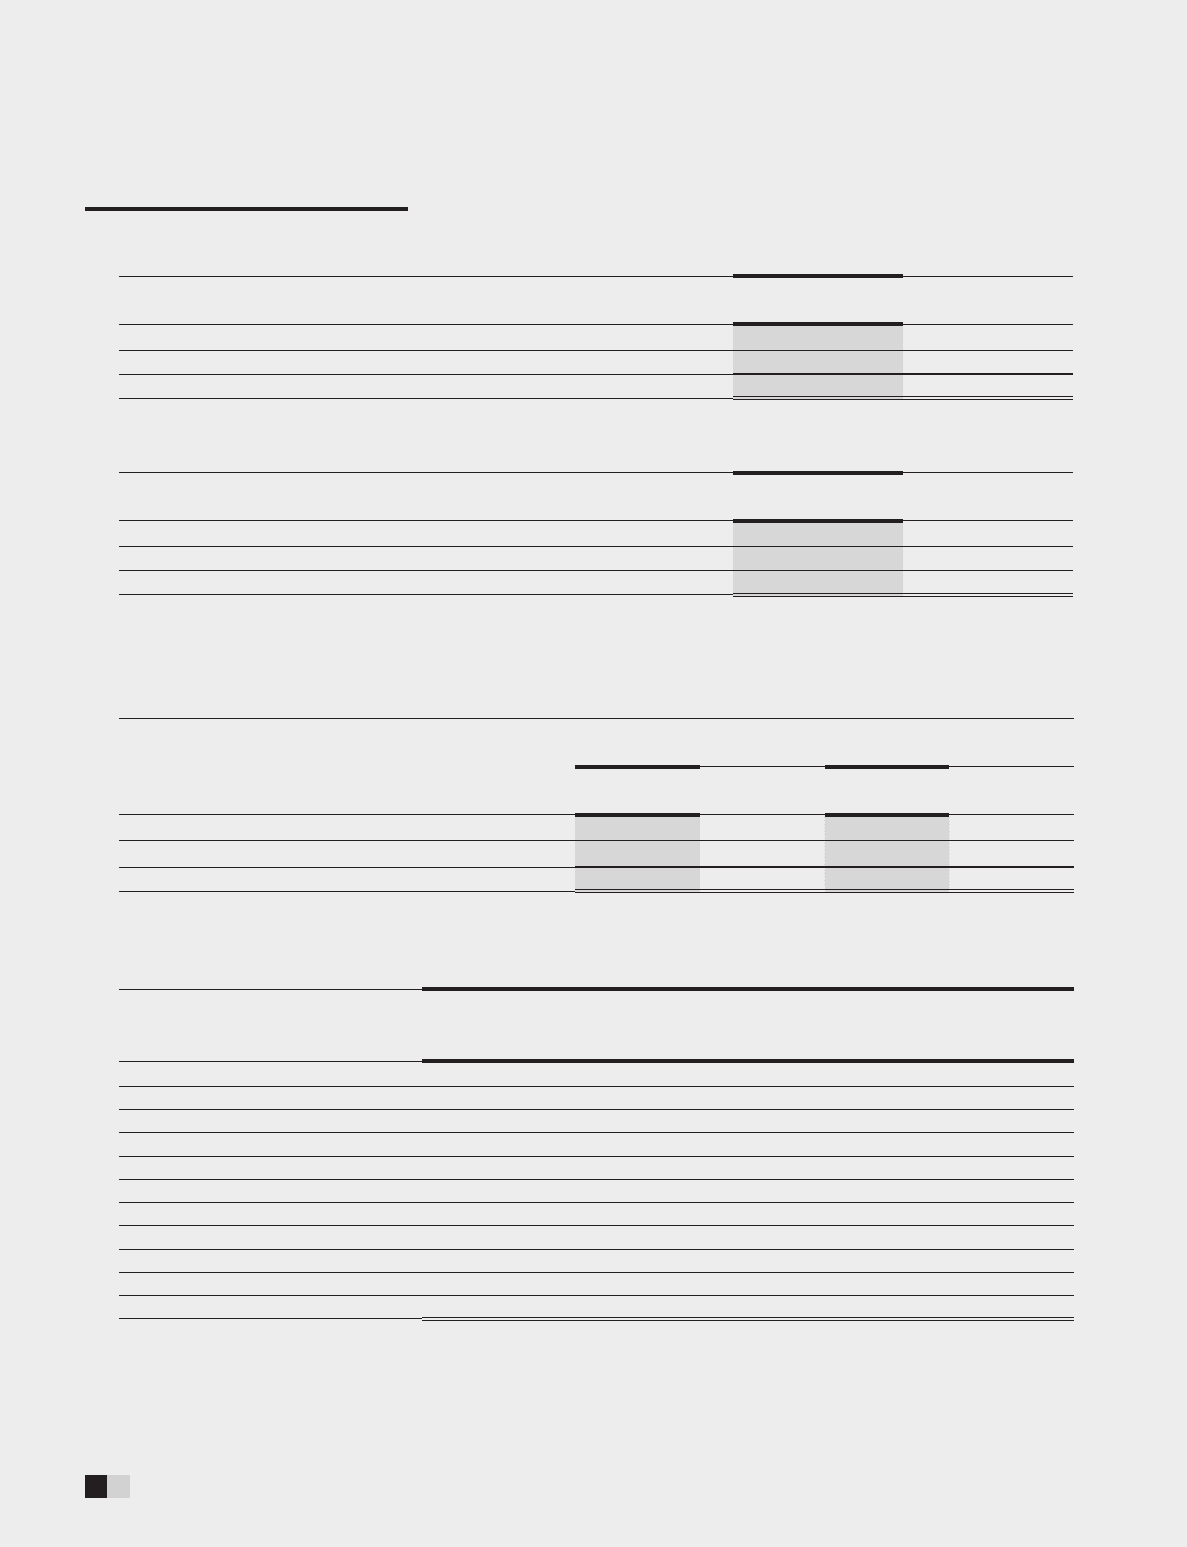
6. Maturity pattern
The following table sets forth, the maturity pattern of assets and liabilities of the Bank at March 31, 2016.
` in million
Maturity buckets Loans &
Advances1
Investment
securities1Deposits1Borrowings1,2
Total foreign
currency
assets3
Total foreign
currency
liabilities3
Day 1 11,629.7 240,862.3 44,306.0 1,775.6 139,997.4 6,297.5
2 to 7 days 35,120.3 91,635.5 115,371.8 48,634.1 149,589.0 20,530.7
8 to 14 days 30,867.1 54,447.0 80,240.7 8,450.3 24,188.8 17,157.8
15 to 28 days 66,217.9 92,784.1 64,017.7 22,148.0 56,646.8 41,235.2
29 days to 3 months 262,943.9 66,139.0 297,478.2 103,160.0 116,419.5 112,508.2
3 to 6 months 293,775.4 83,065.1 262,497.9 132,031.8 84,434.7 61,002.1
6 months to 1 year 544,822.2 142,619.8 536,836.4 401,445.3 170,622.1 548,262.6
1 to 3 years 1,456,284.9 154,822.1 453,906.8 422,158.0 288,600.3 357,848.9
3 to 5 years 716,918.6 278,198.4 1,185,524.7 404,176.1 175,208.6 285,712.5
Above 5 years 934,059.4 399,544.6 1,174,076.9 204,094.6 248,472.2 85,671.8
Total 4,352,639.4 1,604,117.9 4,214,257.1 1,748,073.8 1,454,179.4 1,536,227.3
1. Includes foreign currency balances.
2. Includes borrowings in the nature of subordinated debts and preference shares.
3. Excludes off-balance sheet assets and liabilities.