ICICI Bank 2016 Annual Report Download - page 111
Download and view the complete annual report
Please find page 111 of the 2016 ICICI Bank annual report below. You can navigate through the pages in the report by either clicking on the pages listed below, or by using the keyword search tool below to find specific information within the annual report.-
 1
1 -
2
-
3
-
4
-
5
-
6
-
7
-
8
-
9
-
10
-
11
-
12
-
13
-
14
-
15
-
16
-
17
-
18
-
19
-
20
-
21
-
22
-
23
-
24
-
25
-
26
-
27
-
28
-
29
-
30
-
31
-
32
-
33
-
34
-
35
-
36
-
37
-
38
-
39
-
40
-
41
-
42
-
43
-
44
-
45
-
46
-
47
-
48
-
49
-
50
-
51
-
52
-
53
-
54
-
55
-
56
-
57
-
58
-
59
-
60
-
61
-
62
-
63
-
64
-
65
-
66
-
67
-
68
-
69
-
70
-
71
-
72
-
73
-
74
-
75
-
76
-
77
-
78
-
79
-
80
-
81
-
82
-
83
-
84
-
85
-
86
-
87
-
88
-
89
-
90
-
91
-
92
-
93
-
94
-
95
-
96
-
97
-
98
-
99
-
100
-
 101
101 -
 102
102 -
 103
103 -
 104
104 -
 105
105 -
 106
106 -
 107
107 -
 108
108 -
 109
109 -
 110
110 -
 111
111 -
 112
112 -
 113
113 -
 114
114 -
 115
115 -
 116
116 -
 117
117 -
 118
118 -
 119
119 -
 120
120 -
 121
121 -
122
-
123
-
124
-
125
-
126
-
127
-
128
-
129
-
130
-
131
-
132
-
133
-
134
-
135
-
136
-
137
-
138
-
139
-
140
-
141
-
142
-
143
-
144
-
145
-
146
-
147
-
148
-
149
-
150
-
151
-
152
-
153
-
154
-
155
-
156
-
157
-
158
-
159
-
160
-
161
-
162
-
163
-
164
-
165
-
166
-
167
-
168
-
169
-
170
-
171
-
172
-
173
-
174
-
175
-
176
-
177
-
178
-
179
-
180
-
181
-
182
-
183
-
184
-
185
-
186
-
187
-
188
-
189
-
190
-
191
-
192
-
193
-
194
-
195
-
196
-
197
-
198
-
199
-
200
-
201
-
202
-
203
-
204
-
205
-
206
-
207
-
208
-
209
-
210
-
211
-
212
-
213
-
214
-
215
-
216
-
217
-
218
-
219
-
220
-
221
-
222
-
223
-
224
-
225
-
226
-
227
-
228
-
229
-
230
-
231
-
232
-
233
-
234
-
235
-
236
-
237
-
238
-
239
-
240
-
241
-
242
-
243
-
244
-
245
-
246
-
247
-
248
-
249
-
250
-
251
-
252
 |
 |

109Annual Report 2015-2016
1. Includes home loans, automobile loans, commercial business loans, dealer financing and small ticket loans to small businesses,
personal loans, credit cards, rural loans and loans against securities.
2. Includes loans against FCNR deposits of ` 72.65 billion at March 31, 2016 (March 31, 2015: ` 67.84 billion).
3. Other industries primarily include developer financing portfolio, gems and jewellery, chemical and fertilizers, textile, automobiles,
drugs and pharmaceuticals and FMCG.
4. All amounts have been rounded off to the nearest ` 10.0 million.
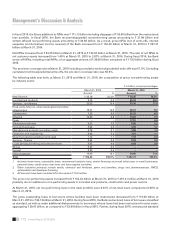
The Bank’s capital allocation framework is focused on higher growth in retail nance segment and lower growth in
corporate lending with an increase in the proportion of higher rated exposures. Given the focus on the above priorities,
gross retail nance advances increased by 22.7% in scal 2016 compared to an increase of 12.8% in total gross advances.
As a result, the share of gross retail nance advances increased from 43.5% of gross advances at March 31, 2015 to
47.3% of gross advances at March 31, 2016. Further, the aggregate net increase in advances to power, roads, ports,
telecom, urban development & other infrastructure, iron/steel & products, metal & products (excluding iron & steel) and
mining sectors was primarily in the ‘A- and above’ category based on the Bank’s internal ratings. The increase in advances
to these sectors also included the impact of currency depreciation between March 31, 2015 and March 31, 2016, on the
rupee equivalent of foreign currency denominated advances made by overseas branches of the Bank.
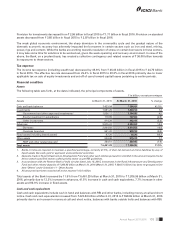
The following table sets forth, at the dates indicated, the composition of the Bank’s gross (net of write-offs) outstanding
retail nance portfolio.
` in billion, except percentages
March 31, 2015 March 31, 2016
Total
retail advances
% of total
retail advances
Total
retail advances
% of total
retail advances
Home loans ` 894.81 51.6% ` 1,098.99 51.6%
Automobile loans 189.97 10.9 224.64 10.5
Commercial business 109.36 6.3 129.16 6.1
Business banking197.11 5.6 114.19 5.3
Personal loans 71.28 4.1 102.15 4.8
Credit cards 41.42 2.4 55.21 2.6
Others2, 3 332.32 19.1 406.36 19.1
Total retail nance portfolio3` 1,736.27 100.0% ` 2,130.70 100.0%
1. Includes dealer financing and small ticket loans to small businesses.
2. Includes rural loans and loans against securities.
3. Includes loans against FCNR deposits of ` 72.65 billion at March 31, 2016 (March 31, 2015: ` 67.84 billion).
4. All amounts have been rounded off to the nearest ` 10.0 million.
The net retail loan portfolio of the Bank grew by 23.3% during scal 2016.
Directed Lending
RBI requires banks to lend to certain sectors of the economy. Such directed lending comprises priority sector lending
and export credit.
Priority Sector Lending and Investment
RBI guidelines on priority sector lending require banks to lend 40.0% of their Adjusted Net Bank Credit (ANBC), to fund
certain types of activities carried out by specied borrowers. The denition of ANBC includes bank credit in India adjusted
by bills rediscounted with RBI and other approved nancial institutions and certain investments and is computed with
reference to the outstanding amount at March 31 of the previous year as prescribed by RBI guidelines ‘Master Circular
- Priority Sector Lending - Targets and Classication’. Further, RBI allowed loans extended in India against incremental
foreign currency non-resident (bank)/non-resident external deposits from July 26, 2013 and outstanding at March 7, 2014
to be excluded from ANBC. In May 2014, RBI issued guidelines allowing banks to include the outstanding investments
in Rural Infrastructure Development Fund and other specied funds at March 31 of the scal year to be classied as
“indirect agriculture” and count towards the overall priority sector target achievement. Such investments at March 31
of the preceding year are included in the ANBC which forms the base for computation of the priority sector and sub-
segment lending requirements. In scal 2015, RBI allowed banks to issue long-term bonds for nancing infrastructure and