ICICI Bank 2016 Annual Report Download - page 147
Download and view the complete annual report
Please find page 147 of the 2016 ICICI Bank annual report below. You can navigate through the pages in the report by either clicking on the pages listed below, or by using the keyword search tool below to find specific information within the annual report.
Annual Report 2015-2016 145
Schedules
forming part of the Accounts (Contd.)
Financial Statements of ICICI Bank Limited
Starting from January 1 2015 2016 2017 2018 2019
Minimum LCR 60.0% 70.0% 80.0% 90.0% 100.0%
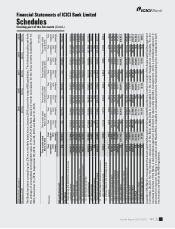
The Bank has been computing its LCR on a monthly basis since January 2015 as per the extant RBI guidelines. The following tables set forth
the average of unweighted and weighted value of the LCR of the Bank, based on month end values, for the three months ended March 31,
2016, December 31, 2015, September 30, 2015, June 30, 2015 and March 31, 2015.
` in million
Particulars
Three months ended
March 31, 2016
Three months ended
March 31, 2015
Three months ended
December 31, 2015
Three months ended
September 30, 2015
Three months ended
June 30, 2015
Total
unweighted
value
(average)
Total
weighted
value
(average)
Total
unweighted
value
(average)
Total
weighted
value
(average)
Total
unweighted
value
(average)
Total
weighted
value
(average)
Total
unweighted
value
(average)
Total
weighted
value
(average)
Total
unweighted
value
(average)
Total
weighted
value
(average)
High quality liquid assets
1 Total high quality liquid assets N.A. 657,810.1 N.A. 569,153.4 N.A. 600,439.4 N.A. 605,808.5 N.A. 534,184.8
Cash outflows
2 Retail deposits and deposits from small business
customers, of which: 2,440,406.7 221,848.3 2,126,588.6 192,404.6 2,315,663.0 209,697.8 2,253,131.1 203,937.6 2,166,232.6 195,869.9
(i) Stable deposits 443,846.9 22,192.3 405,084.6 20,254.2 437,369.7 21,868.5 427,509.4 21,375.5 415,068.1 20,753.4
(ii) Less stable deposits 1,996,559.8 199,656.0 1,721,504.0 172,150.4 1,878,293.3 187,829.3 1,825,621.7 182,562.1 1,751,164.5 175,116.4
3 Unsecured wholesale funding, of which: 1,100,323.2 631,804.6 840,202.0 392,978.7 1,004,305.9 499,300.5 973,669.5 475,086.8 843,829.9 416,069.0
(i) Operational deposits (all counterparties) 185,211.0 46,302.7 320,279.2 80,069.8 174,737.2 43,684.3 165,647.1 41,411.8 144,097.4 36,024.3
(ii) Non-operational deposits
(all counterparties) 838,903.5 509,293.2 477,248.4 270,234.5 746,400.2 372,447.7 740,751.0 366,403.6 661,388.5 341,700.8
(iii) Unsecured debt 76,208.7 76,208.7 42,674.5 42,674.5 83,168.5 83,168.5 67,271.4 67,271.4 38,343.9 38,343.9
4 Secured wholesale funding N.A. – N.A. –N.A. –N.A. –N.A. –
5 Additional requirements, of which: 434,570.4 58,390.8 391,367.9 61,066.2 422,372.4 61,996.2 417,985.6 62,207.6 407,404.9 61,117.7
(i) Outows related to derivative exposures and
other collateral requirements 9,038.0 9,038.0 11,577.8 11,577.8 8,462.4 8,462,4 8,886.5 8,886.5 8,782.9 8,782.9
(ii) Outows related to loss of funding on debt
products 373.7 373.7 476.8 476.8 365.1 365.1 426.1 426.1 414.8 414.8
(iii) Credit and liquidity facilities 425,158.7 48,979.1 379,313.3 49,011.6 413,544.9 53,138.7 408,673.0 52,895.0 398,207.2 51,920.1
6 Other contractual funding obligations 70,145.8 70,145.8 39,648.7 39,648.7 65,305.8 65,305.8 65,243.5 65,243.5 49,265.9 49,265.9
7 Other contingent funding obligations 1,918,495.8 79,602.7 1,936,332.7 96,816.6 1,982,024.6 99,101.2 2,028,664.1 101,433.2 1,940,289.6 97,014.5
8 Total cash outows N.A. 1,061,792.2 N.A. 782,914.9 N.A. 935,401.5 N.A. 907,908.7 N.A. 819,337.0
9 Secured lending (e.g. reverse repos) – – – – – – – – – –
10 Inows from fully performing exposures 381,330.5 319,975.3 252,788.5 197,031.7 254,135.7 205,096.8 242,066.1 187,179.4 245,792.4 193,081.9
11 Other cash inows 43,097.3 23,851.8 43,314.3 24,867.1 38,951.4 21,510.6 39,839.3 22,469.5 38,273.5 21,435.5
12 Total cash inows 424,427.8 343,827.1 296,102.8 221,898.8 293,087.1 226,607.4 281,905.4 209,648.9 284,065.8 214,517.4
13 Total HQLA N.A. 657,810.1 N.A. 569,153.4 N.A. 600,439.4 N.A. 605,808.5 N.A. 534,184.8
14 Total net cash outows N.A. 717,965.1 N.A. 569,153.4 N.A. 708,764.1 N.A. 698,259.8 N.A. 604,819.6
15 Liquidity coverage ratio (%) N.A. 91.62% N.A. 101.45% N.A. 84.72% N.A. 86.76% N.A. 88.32%
Liquidity of the Bank is managed by the Asset Liability Management Group (ALMG) under the central oversight of the Asset Liability Management
Committee (ALCO). For the domestic operations of the Bank, ALMG-India is responsible for the overall management of liquidity. For the
overseas branches of the Bank, a decentralised approach is followed for day-to-day liquidity management, while a centralised approach is
followed for long term funding in co-ordination with Head-Ofce. Liquidity in overseas branches is maintained taking into consideration both
host country as well as the RBI regulations.


