ICICI Bank 2016 Annual Report Download - page 50
Download and view the complete annual report
Please find page 50 of the 2016 ICICI Bank annual report below. You can navigate through the pages in the report by either clicking on the pages listed below, or by using the keyword search tool below to find specific information within the annual report.-
 1
1 -
2
-
3
-
4
-
5
-
6
-
7
-
8
-
9
-
10
-
11
-
12
-
13
-
14
-
15
-
16
-
17
-
18
-
19
-
20
-
21
-
22
-
23
-
24
-
25
-
26
-
27
-
28
-
29
-
30
-
31
-
32
-
33
-
34
-
35
-
36
-
37
-
38
-
39
-
 40
40 -
 41
41 -
 42
42 -
 43
43 -
 44
44 -
 45
45 -
 46
46 -
 47
47 -
 48
48 -
 49
49 -
 50
50 -
 51
51 -
 52
52 -
 53
53 -
 54
54 -
 55
55 -
 56
56 -
 57
57 -
 58
58 -
 59
59 -
 60
60 -
61
-
62
-
63
-
64
-
65
-
66
-
67
-
68
-
69
-
70
-
71
-
72
-
73
-
74
-
75
-
76
-
77
-
78
-
79
-
80
-
81
-
82
-
83
-
84
-
85
-
86
-
87
-
88
-
89
-
90
-
91
-
92
-
93
-
94
-
95
-
96
-
97
-
98
-
99
-
100
-
101
-
102
-
103
-
104
-
105
-
106
-
107
-
108
-
109
-
110
-
111
-
112
-
113
-
114
-
115
-
116
-
117
-
118
-
119
-
120
-
121
-
122
-
123
-
124
-
125
-
126
-
127
-
128
-
129
-
130
-
131
-
132
-
133
-
134
-
135
-
136
-
137
-
138
-
139
-
140
-
141
-
142
-
143
-
144
-
145
-
146
-
147
-
148
-
149
-
150
-
151
-
152
-
153
-
154
-
155
-
156
-
157
-
158
-
159
-
160
-
161
-
162
-
163
-
164
-
165
-
166
-
167
-
168
-
169
-
170
-
171
-
172
-
173
-
174
-
175
-
176
-
177
-
178
-
179
-
180
-
181
-
182
-
183
-
184
-
185
-
186
-
187
-
188
-
189
-
190
-
191
-
192
-
193
-
194
-
195
-
196
-
197
-
198
-
199
-
200
-
201
-
202
-
203
-
204
-
205
-
206
-
207
-
208
-
209
-
210
-
211
-
212
-
213
-
214
-
215
-
216
-
217
-
218
-
219
-
220
-
221
-
222
-
223
-
224
-
225
-
226
-
227
-
228
-
229
-
230
-
231
-
232
-
233
-
234
-
235
-
236
-
237
-
238
-
239
-
240
-
241
-
242
-
243
-
244
-
245
-
246
-
247
-
248
-
249
-
250
-
251
-
252
 |
 |

48
Directors’ Report
Annual Report 2015-2016
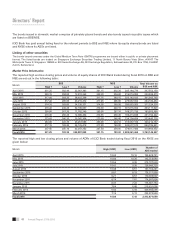
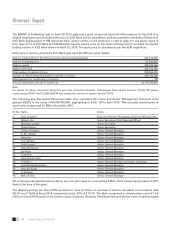
The bonds issued in domestic market comprise of privately placed bonds and also bonds issued via public issues which
are listed on BSE/NSE.
ICICI Bank has paid annual listing fees for the relevant periods to BSE and NSE where its equity shares/bonds are listed
and NYSE where its ADSs are listed.
Listing of other securities
The bonds issued overseas under the Global Medium Term Note (GMTN) programme are issued either in public or private placement
format. The listed bonds are traded on Singapore Exchange Securities Trading Limited, 11 North Buona Vista Drive, #06-07 The
Metropolis Tower 2, Singapore 138589 or SIX Swiss Exchange AG, SIX Exchange Regulation, Selnaustrasse 30, P.O. Box 1758, CH-8021
Zurich, Switzerland.
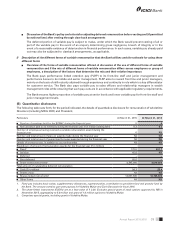
Market Price Information
The reported high and low closing prices and volume of equity shares of ICICI Bank traded during scal 2016 on BSE and
NSE are set out in the following table:
Month BSE NSE Total Volume on
BSE and NSE
High `Low `Volume High `Low `Volume
April 2015 331.25 302.40 22,367,383 331.15 302.30 245,184,776 267,552,159
May 2015 329.15 304.50 13,912,269 329.30 304.60 216,014,004 229,926,273
June 2015 317.40 283.25 28,922,338 317.75 283.15 332,143,422 361,065,760
July 2015 317.40 285.05 23,215,372 317.45 285.00 270,967,092 294,182,464
August 2015 314.10 269.85 24,230,371 314.05 269.95 286,993,903 311,224,274
September 2015 279.40 249.25 32,100,937 279.30 249.10 301,016,092 333,117,029
October 2015 290.00 267.35 11,782,249 290.05 267.10 168,271,739 180,053,988
November 2015 279.30 260.25 12,380,404 279.55 260.45 189,413,838 201,794,242
December 2015 273.60 246.35 29,342,304 273.90 246.40 234,104,424 263,446,728
January 2016 263.00 222.70 23,257,588 263.00 223.10 316,957,199 340,214,787
February 2016 217.15 183.35 56,129,418 217.20 183.00 543,577,573 599,706,991
March 2016 237.45 205.10 32,247,202 237.50 204.95 378,617,400 410,864,602
Fiscal 2016 331.25 183.35 309,887,835 331.15 183.00 3,483,261,462 3,793,149,297
The reported high and low closing prices and volume of ADRs of ICICI Bank traded during scal 2016 on the NYSE are
given below:
Month High (USD) Low (USD) Number of
ADS traded
April 2015 10.94 10.16 156,428,721
May 2015 10.84 10.30 142,753,084
June 2015 10.56 9.36 216,107,534
July 2015 10.47 9.35 128,940,720
August 2015 10.38 8.51 167,182,281
September 2015 8.81 8.19 176,311,999
October 2015 9.21 8.57 170,305,507
November 2015 8.74 7.81 174,907,808
December 2015 8.37 7.22 175,381,754
January 2016 7.64 6.48 219,631,696
February 2016 6.42 5.18 429,945,596
March 2016 7.16 6.12 255,974,959
Fiscal 2016 10.84 5.18 2,413,871,659