ICICI Bank 2016 Annual Report Download - page 114
Download and view the complete annual report
Please find page 114 of the 2016 ICICI Bank annual report below. You can navigate through the pages in the report by either clicking on the pages listed below, or by using the keyword search tool below to find specific information within the annual report.-
 1
1 -
2
-
3
-
4
-
5
-
6
-
7
-
8
-
9
-
10
-
11
-
12
-
13
-
14
-
15
-
16
-
17
-
18
-
19
-
20
-
21
-
22
-
23
-
24
-
25
-
26
-
27
-
28
-
29
-
30
-
31
-
32
-
33
-
34
-
35
-
36
-
37
-
38
-
39
-
40
-
41
-
42
-
43
-
44
-
45
-
46
-
47
-
48
-
49
-
50
-
51
-
52
-
53
-
54
-
55
-
56
-
57
-
58
-
59
-
60
-
61
-
62
-
63
-
64
-
65
-
66
-
67
-
68
-
69
-
70
-
71
-
72
-
73
-
74
-
75
-
76
-
77
-
78
-
79
-
80
-
81
-
82
-
83
-
84
-
85
-
86
-
87
-
88
-
89
-
90
-
91
-
92
-
93
-
94
-
95
-
96
-
97
-
98
-
99
-
100
-
101
-
102
-
103
-
 104
104 -
 105
105 -
 106
106 -
 107
107 -
 108
108 -
 109
109 -
 110
110 -
 111
111 -
 112
112 -
 113
113 -
 114
114 -
 115
115 -
 116
116 -
 117
117 -
 118
118 -
 119
119 -
 120
120 -
 121
121 -
 122
122 -
 123
123 -
 124
124 -
125
-
126
-
127
-
128
-
129
-
130
-
131
-
132
-
133
-
134
-
135
-
136
-
137
-
138
-
139
-
140
-
141
-
142
-
143
-
144
-
145
-
146
-
147
-
148
-
149
-
150
-
151
-
152
-
153
-
154
-
155
-
156
-
157
-
158
-
159
-
160
-
161
-
162
-
163
-
164
-
165
-
166
-
167
-
168
-
169
-
170
-
171
-
172
-
173
-
174
-
175
-
176
-
177
-
178
-
179
-
180
-
181
-
182
-
183
-
184
-
185
-
186
-
187
-
188
-
189
-
190
-
191
-
192
-
193
-
194
-
195
-
196
-
197
-
198
-
199
-
200
-
201
-
202
-
203
-
204
-
205
-
206
-
207
-
208
-
209
-
210
-
211
-
212
-
213
-
214
-
215
-
216
-
217
-
218
-
219
-
220
-
221
-
222
-
223
-
224
-
225
-
226
-
227
-
228
-
229
-
230
-
231
-
232
-
233
-
234
-
235
-
236
-
237
-
238
-
239
-
240
-
241
-
242
-
243
-
244
-
245
-
246
-
247
-
248
-
249
-
250
-
251
-
252
 |
 |

112
Management’s Discussion & Analysis
Annual Report 2015-2016
In scal 2016, the Gross additions to NPAs was ` 171.13 billion including slippages of ` 53.00 billion from the restructured
loan portfolio. In scal 2016, the Bank recovered/upgraded non-performing assets amounting to ` 21.84 billion and
written-off/sold non-performing assets amounting to ` 34.50 billion. As a result, gross NPAs (net of write-offs, interest
suspense and derivatives income reversal) of the Bank increased from ` 152.42 billion at March 31, 2015 to ` 267.21
billion at March 31, 2016.
Net NPAs increased from ` 63.25 billion at March 31, 2015 to ` 132.97 billion at March 31, 2016. The ratio of net NPAs to
net customer assets increased from 1.40% at March 31, 2015 to 2.67% at March 31, 2016. During scal 2016, the Bank
wrote-off NPAs, including retail NPAs, of an aggregate amount of ` 30.05 billion compared to ` 17.03 billion during scal
2015.
The provision coverage ratio at March 31, 2016 including cumulative technical/prudential write-offs was 61.0%. Excluding
cumulative technical/prudential write-offs, the provision coverage ratio was 50.6%.
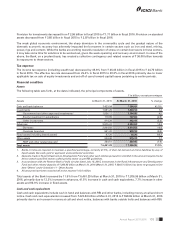
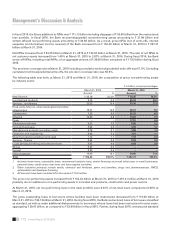
The following table sets forth, at March 31, 2015 and March 31, 2016, the composition of gross non-performing assets
by industry sector.
` in billion, except percentages
March 31, 2015 March 31, 2016
Amount % Amount %
Retail nance1` 33.78 22.2% ` 38.25 14.3%
Iron/steel and products 9.74 6.4 65.04 24.3
Services – non-nance 23.53 15.4 29.30 11.0
Road, ports, telecom, urban development and other
infrastructure 18.27 12.0 26.01 9.7
Construction 7.36 4.8 22.22 8.3
Shipping 15.00 9.8 19.60 7.3
Power – – 17.51 6.6
Wholesale/retail trade 4.53 3.0 5.90 2.2
Food and beverages 3.94 2.6 4.55 1.7
Manufacturing products (excluding metal) 4.78 3.1 3.58 1.3
Electronics and engineering 8.06 5.3 3.01 1.1
Metal & products (excluding iron & steel) 1.72 1.1 1.10 0.4
Services – nance 0.56 0.4 0.52 0.2
Crude petroleum/rening and petrochemicals 0.02 0.0 0.02 0.0
Mining 0.93 0.6 – –
Cement 0.30 0.2 – –
Other industries219.90 13.1 30.60 11.6
Total ` 152.42 100.0% ` 267.21 100.0%
1. Includes home loans, automobile loans, commercial business loans, dealer financing and small ticket loans to small businesses,
personal loans, credit cards, rural loans and loans against securities.
2. Other industries primarily include textile, chemical and fertilizers, gems and jewellery, drugs and pharmaceuticals, FMCG,
automobiles and developer financing.
3. All amounts have been rounded off to the nearest ` 10.0 million.
The gross non-performing assets increased from ` 152.42 billion at March 31, 2015 to ` 267.21 billion at March 31, 2016
primarily due to additions in non-performing assets in iron/steel and products, construction and power sectors.
At March 31, 2016, net non-performing loans in the retail portfolio were 0.61% of net retail loans compared to 0.60% at
March 31, 2015.
The gross outstanding loans to borrowers whose facilities have been restructured decreased from ` 119.46 billion at
March 31, 2015 to ` 93.13 billion at March 31, 2016. During scal 2016, the Bank restructured loans of borrowers classied
as standard, as well as made additional disbursements to borrowers whose loans had been restructured in prior years,
aggregating ` 29.47 billion, as compared to ` 53.69 billion in scal 2015. Further, during scal 2016, restructured standard