ICICI Bank 2016 Annual Report Download - page 126
Download and view the complete annual report
Please find page 126 of the 2016 ICICI Bank annual report below. You can navigate through the pages in the report by either clicking on the pages listed below, or by using the keyword search tool below to find specific information within the annual report.-
 1
1 -
2
-
3
-
4
-
5
-
6
-
7
-
8
-
9
-
10
-
11
-
12
-
13
-
14
-
15
-
16
-
17
-
18
-
19
-
20
-
21
-
22
-
23
-
24
-
25
-
26
-
27
-
28
-
29
-
30
-
31
-
32
-
33
-
34
-
35
-
36
-
37
-
38
-
39
-
40
-
41
-
42
-
43
-
44
-
45
-
46
-
47
-
48
-
49
-
50
-
51
-
52
-
53
-
54
-
55
-
56
-
57
-
58
-
59
-
60
-
61
-
62
-
63
-
64
-
65
-
66
-
67
-
68
-
69
-
70
-
71
-
72
-
73
-
74
-
75
-
76
-
77
-
78
-
79
-
80
-
81
-
82
-
83
-
84
-
85
-
86
-
87
-
88
-
89
-
90
-
91
-
92
-
93
-
94
-
95
-
96
-
97
-
98
-
99
-
100
-
101
-
102
-
103
-
104
-
105
-
106
-
107
-
108
-
109
-
110
-
111
-
112
-
113
-
114
-
115
-
 116
116 -
 117
117 -
 118
118 -
 119
119 -
 120
120 -
 121
121 -
 122
122 -
 123
123 -
 124
124 -
 125
125 -
 126
126 -
 127
127 -
 128
128 -
 129
129 -
 130
130 -
 131
131 -
 132
132 -
 133
133 -
 134
134 -
 135
135 -
 136
136 -
137
-
138
-
139
-
140
-
141
-
142
-
143
-
144
-
145
-
146
-
147
-
148
-
149
-
150
-
151
-
152
-
153
-
154
-
155
-
156
-
157
-
158
-
159
-
160
-
161
-
162
-
163
-
164
-
165
-
166
-
167
-
168
-
169
-
170
-
171
-
172
-
173
-
174
-
175
-
176
-
177
-
178
-
179
-
180
-
181
-
182
-
183
-
184
-
185
-
186
-
187
-
188
-
189
-
190
-
191
-
192
-
193
-
194
-
195
-
196
-
197
-
198
-
199
-
200
-
201
-
202
-
203
-
204
-
205
-
206
-
207
-
208
-
209
-
210
-
211
-
212
-
213
-
214
-
215
-
216
-
217
-
218
-
219
-
220
-
221
-
222
-
223
-
224
-
225
-
226
-
227
-
228
-
229
-
230
-
231
-
232
-
233
-
234
-
235
-
236
-
237
-
238
-
239
-
240
-
241
-
242
-
243
-
244
-
245
-
246
-
247
-
248
-
249
-
250
-
251
-
252
 |
 |

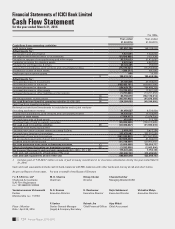
124 Annual Report 2015-2016
for the year ended March 31, 2016
Cash Flow Statement
` in ‘000s
Year ended
31.03.2016
Year ended
31.03.2015
Cash ow from operating activities
Prot before taxes 121,957,196 158,199,234
Adjustments for:
Depreciation and amortisation 7,541,591 7,344,649
Net (appreciation)/depreciation on investments1 (33,500,856) (152,338)
Provision in respect of non-performing and other assets 83,276,673 31,412,687
Prudential provision for standard assets 2,970,064 3,847,873
Provision for contingencies & others 28,724,485 760,070
Income from subsidiaries, joint ventures and consolidated entities (15,375,521) (15,750,993)
(Prot)/loss on sale of xed assets (280,717) (69,186)
Employees stock options grants 806 16,390
(i) 195,313,721 185,608,386
Adjustments for:
(Increase)/decrease in investments 67,185,855 47,156,074
(Increase)/decrease in advances (568,482,751) (539,603,596)
Increase/(decrease) in deposits 598,629,787 296,490,730
(Increase)/decrease in other assets (10,782,335) 17,501,230
Increase/(decrease) in other liabilities and provisions (1,791,686) (13,721,352)
(ii) 84,758,870 (192,176,914)
Refund/(payment) of direct taxes (iii) (55,787,902) (41,676,358)
Net cash ow from/(used in) operating activities (i)+(ii)+(iii) (A) 224,284,689 (48,244,886)
Cash ow from investing activities
Redemption/sale from/(investments in) subsidiaries and/or joint ventures
(including application money) 41,459,527 8,724,904
Income from subsidiaries, joint ventures and consolidated entities 15,375,521 15,750,993
Purchase of xed assets (7,004,911) (7,874,256)
Proceeds from sale of xed assets 651,004 313,705
(Purchase)/sale of held to maturity securities (89,980,988) (108,910,985)
Net cash used in investing activities (B) (39,499,847) (91,995,639)
Cash ow from nancing activities
Proceeds from issue of share capital (including ESOPs) 2,824,200 3,477,284
Proceeds from long term borrowings 332,678,447 352,031,564
Repayment of long term borrowings (261,945,823) (217,591,059)
Net proceeds/(repayment) of short term borrowings (47,669,402) 41,044,010
Dividend and dividend tax paid (31,738,089) (28,905,082)
Net cash generated from/(used in) nancing activities (C) (5,850,668) 150,056,717
Effect of exchange uctuation on translation reserve (D) (3,292,908) (2,065,996)
Net increase/(decrease) in cash and cash equivalents (A) + (B) + (C) + (D) 175,641,266 7,750,196
Cash and cash equivalents at beginning of the year 423,046,153 415,295,957
Cash and cash equivalents at end of the year 598,687,419 423,046,153
1. Includes gain of ` 33,683.7 million on sale of part of equity investment in its insurance subsidiaries during the year ended March
31, 2016.
Cash and cash equivalents include cash in hand, balances with RBI, balances with other banks and money at call and short notice.
Financial Statements of ICICI Bank Limited
As per our Report of even date.
For B S R & Co. LLP
Chartered Accountants
ICAI Firm Registration
no.: 101248W/W-100022
Venkataramanan Vishwanath
Partner
Membership no.: 113156
Place : Mumbai
Date : April 29, 2016
For and on behalf of the Board of Directors
M. K. Sharma Dileep Choksi Chanda Kochhar
Chairman Director Managing Director & CEO
N. S. Kannan K. Ramkumar Rajiv Sabharwal Vishakha Mulye
Executive Director Executive Director Executive Director Executive Director
P. Sanker Rakesh Jha Ajay Mittal
Senior General Manager Chief Financial Ofcer Chief Accountant
(Legal) & Company Secretary