ICICI Bank 2016 Annual Report Download - page 104
Download and view the complete annual report
Please find page 104 of the 2016 ICICI Bank annual report below. You can navigate through the pages in the report by either clicking on the pages listed below, or by using the keyword search tool below to find specific information within the annual report.-
 1
1 -
2
-
3
-
4
-
5
-
6
-
7
-
8
-
9
-
10
-
11
-
12
-
13
-
14
-
15
-
16
-
17
-
18
-
19
-
20
-
21
-
22
-
23
-
24
-
25
-
26
-
27
-
28
-
29
-
30
-
31
-
32
-
33
-
34
-
35
-
36
-
37
-
38
-
39
-
40
-
41
-
42
-
43
-
44
-
45
-
46
-
47
-
48
-
49
-
50
-
51
-
52
-
53
-
54
-
55
-
56
-
57
-
58
-
59
-
60
-
61
-
62
-
63
-
64
-
65
-
66
-
67
-
68
-
69
-
70
-
71
-
72
-
73
-
74
-
75
-
76
-
77
-
78
-
79
-
80
-
81
-
82
-
83
-
84
-
85
-
86
-
87
-
88
-
89
-
90
-
91
-
92
-
93
-
 94
94 -
 95
95 -
 96
96 -
 97
97 -
 98
98 -
 99
99 -
 100
100 -
 101
101 -
 102
102 -
 103
103 -
 104
104 -
 105
105 -
 106
106 -
 107
107 -
 108
108 -
 109
109 -
 110
110 -
 111
111 -
 112
112 -
 113
113 -
 114
114 -
115
-
116
-
117
-
118
-
119
-
120
-
121
-
122
-
123
-
124
-
125
-
126
-
127
-
128
-
129
-
130
-
131
-
132
-
133
-
134
-
135
-
136
-
137
-
138
-
139
-
140
-
141
-
142
-
143
-
144
-
145
-
146
-
147
-
148
-
149
-
150
-
151
-
152
-
153
-
154
-
155
-
156
-
157
-
158
-
159
-
160
-
161
-
162
-
163
-
164
-
165
-
166
-
167
-
168
-
169
-
170
-
171
-
172
-
173
-
174
-
175
-
176
-
177
-
178
-
179
-
180
-
181
-
182
-
183
-
184
-
185
-
186
-
187
-
188
-
189
-
190
-
191
-
192
-
193
-
194
-
195
-
196
-
197
-
198
-
199
-
200
-
201
-
202
-
203
-
204
-
205
-
206
-
207
-
208
-
209
-
210
-
211
-
212
-
213
-
214
-
215
-
216
-
217
-
218
-
219
-
220
-
221
-
222
-
223
-
224
-
225
-
226
-
227
-
228
-
229
-
230
-
231
-
232
-
233
-
234
-
235
-
236
-
237
-
238
-
239
-
240
-
241
-
242
-
243
-
244
-
245
-
246
-
247
-
248
-
249
-
250
-
251
-
252
 |
 |

102
Management’s Discussion & Analysis
Annual Report 2015-2016
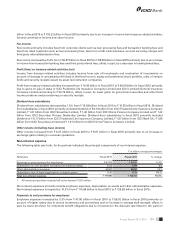
government securities. The number of employees was 67,857 at March 31, 2015 and 74,096 at March 31, 2016 (average
staff strength was 69,853 for scal 2015 and 71,810 for scal 2016). The employee base includes sales executives,
employees on xed term contracts and interns.
Depreciation
Depreciation on owned property increased by 8.9% from ` 6.24 billion in scal 2015 to ` 6.79 billion in scal 2016 due to
an increase in xed assets with higher depreciation rates. Depreciation on leased assets decreased from ` 0.35 billion in
scal 2015 to ` 0.19 billion in scal 2016.
Other administrative expenses
Other administrative expenses primarily include rent, taxes and lighting, advertisement, sales promotion, repairs and
maintenance, direct marketing expenses and other expenditure. Other administrative expenses increased by 14.7% from
` 60.87 billion in scal 2015 to ` 69.83 billion in scal 2016. The increase in other administrative expenses was primarily
due to an increase in the Bank’s branch and ATM network and retail business volumes. The number of branches in India
increased from 4,050 at March 31, 2015 to 4,450 at March 31, 2016. The ATM network of the Bank increased from 12,451
ATMs at March 31, 2015 to 13,766 ATMs at March 31, 2016.
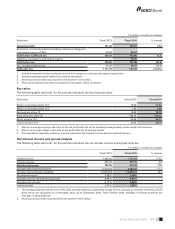
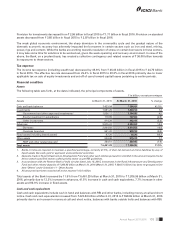
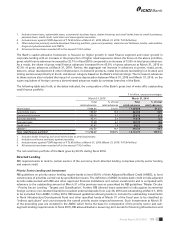
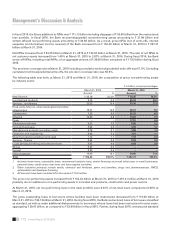
Provisions and contingencies (excluding provisions for tax)
The following table sets forth, for the periods indicated, the components of provisions and contingencies.
` in billion, except percentages
Particulars Fiscal 2015 Fiscal 2016 % change
Provision for non-performing and other assets1` 31.41 ` 72.16 –
Provision for investments (including credit substitutes) (net) 2.98 1.71 (42.6)
Provision for standard assets 3.85 2.97 (22.9)
Others 0.76 3.84 –
Total provisions and contingencies (excluding collective
contingency and related reserve and provision for tax) 39.00 80.67 –
Collective contingency and related reserve –36.00 –
Total provisions and contingencies (excluding provision for tax) ` 39.00 ` 116.67 –
1. Includes restructuring related provision.
2. All amounts have been rounded off to the nearest ` 10.0 million.
Provisions are made by the Bank on standard, sub-standard and doubtful assets at rates prescribed by RBI. Loss assets
and the unsecured portion of doubtful assets are provided for/written off as required by RBI guidelines. For loans and
advances of overseas branches, provisions are made as per RBI regulations or host country regulations whichever is
higher. Provisions on retail non-performing loans are made at the borrower level in accordance with the retail assets
provisioning policy of the Bank, subject to the minimum provisioning levels prescribed by RBI. The specic provisions
on retail loans and advances held by the Bank are higher than the minimum regulatory requirement. Provision on loans
and advances restructured/rescheduled is made in accordance with the applicable RBI guidelines on restructuring of
loans and advances by banks. In addition to the specic provision on NPAs, the Bank maintains a general provision on
standard loans and advances at rates prescribed by RBI. For standard loans and advances in overseas branches, the
general provision is made at the higher of host country regulatory requirements and RBI requirements.
Provisions and contingencies (excluding collective contingency and related reserve and provisions for tax) increased from
` 39.00 billion in scal 2015 to ` 80.67 billion in scal 2016. This increase was primarily due to an increase in provisions
on non-performing assets. Provision for non-performing and other assets increased from ` 31.41 billion in scal 2015
to ` 72.16 billion in scal 2016 primarily due to an increase in additions to non-performing assets in the corporate and
small and medium enterprises loan portfolio, including downgrades from the restructured loan portfolio. The provision
coverage ratio at March 31, 2016 including cumulative technical/prudential write-offs was 61.0%. Excluding cumulative
technical/prudential write-offs, the provision coverage ratio was 50.6%.