ICICI Bank 2016 Annual Report Download - page 116
Download and view the complete annual report
Please find page 116 of the 2016 ICICI Bank annual report below. You can navigate through the pages in the report by either clicking on the pages listed below, or by using the keyword search tool below to find specific information within the annual report.-
 1
1 -
2
-
3
-
4
-
5
-
6
-
7
-
8
-
9
-
10
-
11
-
12
-
13
-
14
-
15
-
16
-
17
-
18
-
19
-
20
-
21
-
22
-
23
-
24
-
25
-
26
-
27
-
28
-
29
-
30
-
31
-
32
-
33
-
34
-
35
-
36
-
37
-
38
-
39
-
40
-
41
-
42
-
43
-
44
-
45
-
46
-
47
-
48
-
49
-
50
-
51
-
52
-
53
-
54
-
55
-
56
-
57
-
58
-
59
-
60
-
61
-
62
-
63
-
64
-
65
-
66
-
67
-
68
-
69
-
70
-
71
-
72
-
73
-
74
-
75
-
76
-
77
-
78
-
79
-
80
-
81
-
82
-
83
-
84
-
85
-
86
-
87
-
88
-
89
-
90
-
91
-
92
-
93
-
94
-
95
-
96
-
97
-
98
-
99
-
100
-
101
-
102
-
103
-
104
-
105
-
 106
106 -
 107
107 -
 108
108 -
 109
109 -
 110
110 -
 111
111 -
 112
112 -
 113
113 -
 114
114 -
 115
115 -
 116
116 -
 117
117 -
 118
118 -
 119
119 -
 120
120 -
 121
121 -
 122
122 -
 123
123 -
 124
124 -
 125
125 -
 126
126 -
127
-
128
-
129
-
130
-
131
-
132
-
133
-
134
-
135
-
136
-
137
-
138
-
139
-
140
-
141
-
142
-
143
-
144
-
145
-
146
-
147
-
148
-
149
-
150
-
151
-
152
-
153
-
154
-
155
-
156
-
157
-
158
-
159
-
160
-
161
-
162
-
163
-
164
-
165
-
166
-
167
-
168
-
169
-
170
-
171
-
172
-
173
-
174
-
175
-
176
-
177
-
178
-
179
-
180
-
181
-
182
-
183
-
184
-
185
-
186
-
187
-
188
-
189
-
190
-
191
-
192
-
193
-
194
-
195
-
196
-
197
-
198
-
199
-
200
-
201
-
202
-
203
-
204
-
205
-
206
-
207
-
208
-
209
-
210
-
211
-
212
-
213
-
214
-
215
-
216
-
217
-
218
-
219
-
220
-
221
-
222
-
223
-
224
-
225
-
226
-
227
-
228
-
229
-
230
-
231
-
232
-
233
-
234
-
235
-
236
-
237
-
238
-
239
-
240
-
241
-
242
-
243
-
244
-
245
-
246
-
247
-
248
-
249
-
250
-
251
-
252
 |
 |

114
Management’s Discussion & Analysis
Annual Report 2015-2016
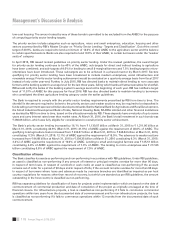
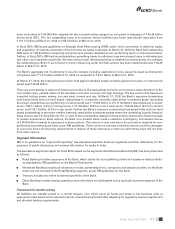
Retail banking segment
The prot before tax of the retail banking segment increased from ` 27.24 billion in scal 2015 to ` 38.98 billion in scal
2016 due to an increase in net interest income and non-interest income, offset, in part, by an increase in non-interest
expenses and higher provisions.
Net interest income increased by 28.7% from ` 71.42 billion in scal 2015 to ` 91.91 billion in scal 2016 primarily due to
growth in the loan portfolio and an increase in average current account and savings account deposits.
Non-interest income increased by 14.6% from ` 42.77 billion in scal 2015 to ` 49.02 billion in scal 2016, primarily due
to a higher level of loan processing fees, third party product distribution fees, fees from the credit cards business and
transaction banking fees.
Non-interest expenses increased by 13.7% from ` 86.15 billion in scal 2015 to ` 97.97 billion in scal 2016, primarily due
to an increase in the retail lending business and expansion in the branch network. Provision charge increased from ` 0.80
billion in scal 2015 to ` 3.99 billion in scal 2016.
Wholesale banking segment
The wholesale banking segment incurred a loss of ` 12.45 billion in scal 2016 primarily due to an increase in provisions.
Net interest income decreased by 1.0% from ` 84.47 billion in scal 2015 to ` 83.61 billion in scal 2016 primarily due
to the higher additions to non-performing loans, on which interest income is not accrued, offset, in part, by an increase
in net interest income on account of an increase in the portfolio size. Provisions increased from ` 35.39 billion in scal
2015 to ` 108.15 billion in scal 2016 primarily due to an increase in additions to non-performing assets and creation of
a collective contingency and related reserve of ` 36.00 billion on a prudent basis during quarter ended March 31, 2016.
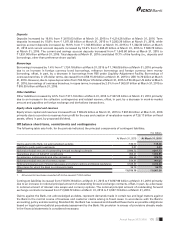
Treasury segment
The prot before tax of the treasury segment increased from ` 64.50 billion in scal 2015 to ` 90.97 billion in scal 2016
primarily due to an increase in non-interest income. The non-interest income was higher primarily due to prot on sale of
stakes in subsidiaries, higher exchange rate gains on repatriation of retained earnings from overseas branches and higher
gains on government securities and other xed income securities.
Other banking segment
The prot before tax of the other banking segment increased from ` 4.22 billion in scal 2015 to ` 4.46 billion in scal 2016
primarily due to higher net interest income.
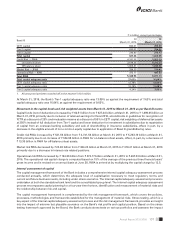
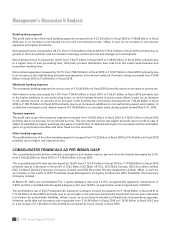
CONSOLIDATED FINANCIALS AS PER INDIAN GAAP
The consolidated prot before collective contingency and related reserve, tax and minority interest decreased by 2.4%
from ` 183.39 billion in scal 2015 to ` 179.04 billion in scal 2016.
The consolidated prot after tax decreased by 16.9% from ` 122.47 billion in scal 2015 to ` 101.80 billion in scal 2016
primarily due to a decrease in the prot of ICICI Bank, ICICI Bank UK PLC, ICICI Bank Canada, ICICI Securities Limited,
ICICI Lombard General Insurance Company Limited and ICICI Securities Primary Dealership Limited, offset, in part, by
an increase in the prot of ICICI Prudential Asset Management Company Limited and ICICI Prudential Life Insurance
Company Limited.
At March 31, 2016, the consolidated Tier-1 capital adequacy ratio was 13.13% as against the regulatory requirement of
7.63% and the consolidated total capital adequacy ratio was 16.60% as against the current requirement of 9.63%.
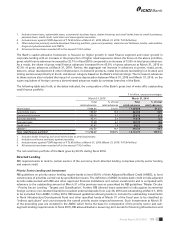
The prot before tax of ICICI Prudential Life Insurance Company Limited increased from ` 16.34 billion in scal 2015 to
` 17.72 billion in scal 2016 primarily due to an increase in net premium earned and investment income and a decrease
in provision for policyholder liabilities, offset, in part, by an increase in transfer to linked funds and operating expenses.
However, prot after tax increased only marginally from ` 16.34 billion in scal 2015 to ` 16.50 billion in scal 2016 due
to a tax charge of ` 1.22 billion in scal 2016 as compared to nil tax charge in scal 2015.