ICICI Bank 2016 Annual Report Download - page 208
Download and view the complete annual report
Please find page 208 of the 2016 ICICI Bank annual report below. You can navigate through the pages in the report by either clicking on the pages listed below, or by using the keyword search tool below to find specific information within the annual report.-
 1
1 -
2
-
3
-
4
-
5
-
6
-
7
-
8
-
9
-
10
-
11
-
12
-
13
-
14
-
15
-
16
-
17
-
18
-
19
-
20
-
21
-
22
-
23
-
24
-
25
-
26
-
27
-
28
-
29
-
30
-
31
-
32
-
33
-
34
-
35
-
36
-
37
-
38
-
39
-
40
-
41
-
42
-
43
-
44
-
45
-
46
-
47
-
48
-
49
-
50
-
51
-
52
-
53
-
54
-
55
-
56
-
57
-
58
-
59
-
60
-
61
-
62
-
63
-
64
-
65
-
66
-
67
-
68
-
69
-
70
-
71
-
72
-
73
-
74
-
75
-
76
-
77
-
78
-
79
-
80
-
81
-
82
-
83
-
84
-
85
-
86
-
87
-
88
-
89
-
90
-
91
-
92
-
93
-
94
-
95
-
96
-
97
-
98
-
99
-
100
-
101
-
102
-
103
-
104
-
105
-
106
-
107
-
108
-
109
-
110
-
111
-
112
-
113
-
114
-
115
-
116
-
117
-
118
-
119
-
120
-
121
-
122
-
123
-
124
-
125
-
126
-
127
-
128
-
129
-
130
-
131
-
132
-
133
-
134
-
135
-
136
-
137
-
138
-
139
-
140
-
141
-
142
-
143
-
144
-
145
-
146
-
147
-
148
-
149
-
150
-
151
-
152
-
153
-
154
-
155
-
156
-
157
-
158
-
159
-
160
-
161
-
162
-
163
-
164
-
165
-
166
-
167
-
168
-
169
-
170
-
171
-
172
-
173
-
174
-
175
-
176
-
177
-
178
-
179
-
180
-
181
-
182
-
183
-
184
-
185
-
186
-
187
-
188
-
189
-
190
-
191
-
192
-
193
-
194
-
195
-
196
-
197
-
 198
198 -
 199
199 -
 200
200 -
 201
201 -
 202
202 -
 203
203 -
 204
204 -
 205
205 -
 206
206 -
 207
207 -
 208
208 -
 209
209 -
 210
210 -
 211
211 -
 212
212 -
 213
213 -
 214
214 -
 215
215 -
 216
216 -
 217
217 -
 218
218 -
219
-
220
-
221
-
222
-
223
-
224
-
225
-
226
-
227
-
228
-
229
-
230
-
231
-
232
-
233
-
234
-
235
-
236
-
237
-
238
-
239
-
240
-
241
-
242
-
243
-
244
-
245
-
246
-
247
-
248
-
249
-
250
-
251
-
252
 |
 |

Annual Report 2015-2016206
Schedules
forming part of the Consolidated Balance Sheet (Contd.)
Consolidated Financial Statements
` in ‘000s
At
31.03.2016
At
31.03.2015
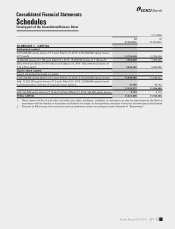
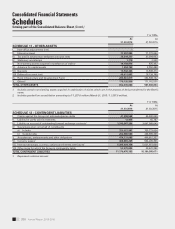
SCHEDULE 8 - INVESTMENTS
I. Investments in India [net of provisions]
i) Government securities 1,436,810,801 1,334,237,788
ii) Other approved securities ––
iii) Shares (includes equity and preference shares)1 78,470,821 70,833,737
iv) Debentures and bonds 205,599,336 235,166,133
v) Assets held to cover linked liabilities of life insurance business 752,957,948 747,775,359
vi) Others (commercial paper, mutual fund units, pass through certicates,
security receipts, certicate of deposits)2 271,392,503 268,734,925
TOTAL INVESTMENTS IN INDIA 2,745,231,409 2,656,747,942
II. Investments outside India [net of provisions]
i) Government securities 61,032,012 52,301,686
ii) Others (equity shares, bonds and certicate of deposits) 54,177,451 34,058,481
TOTAL INVESTMENTS OUTSIDE INDIA 115,209,463 86,360,167
TOTAL INVESTMENTS 2,860,440,872 2,743,108,109
A. Investments in India
Gross value of investments3 2,760,752,923 2,662,884,603
Less: Aggregate of provision/depreciation/(appreciation) 15,521,514 6,136,661
Net investments 2,745,231,409 2,656,747,942
B. Investments outside India
Gross value of investments 117,260,970 87,689,018
Less: Aggregate of provision/depreciation/(appreciation) 2,051,507 1,328,851
Net investments 115,209,463 86,360,167
TOTAL INVESTMENTS 2,860,440,872 2,743,108,109
1. Includes cost of investment in associates amounting to ` 3,696.1 million (March 31, 2015: ` 4,590.5 million).
2. In accordance with RBI circular dated July 16, 2015, investment in Rural Infrastructure and Development Fund and other related
deposits of ` 280,661.8 million (March 31, 2015: ` 284,508.2 million) has been re-classified to line item ‘Rural Infrastructure and
Development Fund’ under Schedule 11 - Other Assets.
3. Includes net appreciation amounting to ` 69,077.9 million (March 31, 2015: ` 140,769.2 million) on investments held to cover linked
liabilities of life insurance business.