ICICI Bank 2016 Annual Report Download - page 110
Download and view the complete annual report
Please find page 110 of the 2016 ICICI Bank annual report below. You can navigate through the pages in the report by either clicking on the pages listed below, or by using the keyword search tool below to find specific information within the annual report.-
 1
1 -
2
-
3
-
4
-
5
-
6
-
7
-
8
-
9
-
10
-
11
-
12
-
13
-
14
-
15
-
16
-
17
-
18
-
19
-
20
-
21
-
22
-
23
-
24
-
25
-
26
-
27
-
28
-
29
-
30
-
31
-
32
-
33
-
34
-
35
-
36
-
37
-
38
-
39
-
40
-
41
-
42
-
43
-
44
-
45
-
46
-
47
-
48
-
49
-
50
-
51
-
52
-
53
-
54
-
55
-
56
-
57
-
58
-
59
-
60
-
61
-
62
-
63
-
64
-
65
-
66
-
67
-
68
-
69
-
70
-
71
-
72
-
73
-
74
-
75
-
76
-
77
-
78
-
79
-
80
-
81
-
82
-
83
-
84
-
85
-
86
-
87
-
88
-
89
-
90
-
91
-
92
-
93
-
94
-
95
-
96
-
97
-
98
-
99
-
 100
100 -
 101
101 -
 102
102 -
 103
103 -
 104
104 -
 105
105 -
 106
106 -
 107
107 -
 108
108 -
 109
109 -
 110
110 -
 111
111 -
 112
112 -
 113
113 -
 114
114 -
 115
115 -
 116
116 -
 117
117 -
 118
118 -
 119
119 -
 120
120 -
121
-
122
-
123
-
124
-
125
-
126
-
127
-
128
-
129
-
130
-
131
-
132
-
133
-
134
-
135
-
136
-
137
-
138
-
139
-
140
-
141
-
142
-
143
-
144
-
145
-
146
-
147
-
148
-
149
-
150
-
151
-
152
-
153
-
154
-
155
-
156
-
157
-
158
-
159
-
160
-
161
-
162
-
163
-
164
-
165
-
166
-
167
-
168
-
169
-
170
-
171
-
172
-
173
-
174
-
175
-
176
-
177
-
178
-
179
-
180
-
181
-
182
-
183
-
184
-
185
-
186
-
187
-
188
-
189
-
190
-
191
-
192
-
193
-
194
-
195
-
196
-
197
-
198
-
199
-
200
-
201
-
202
-
203
-
204
-
205
-
206
-
207
-
208
-
209
-
210
-
211
-
212
-
213
-
214
-
215
-
216
-
217
-
218
-
219
-
220
-
221
-
222
-
223
-
224
-
225
-
226
-
227
-
228
-
229
-
230
-
231
-
232
-
233
-
234
-
235
-
236
-
237
-
238
-
239
-
240
-
241
-
242
-
243
-
244
-
245
-
246
-
247
-
248
-
249
-
250
-
251
-
252
 |
 |

108
Management’s Discussion & Analysis
Annual Report 2015-2016
on the capital ratios and the adequacy of capital buffers for current and future periods. The Bank periodically assesses
and renes its stress testing framework in an effort to ensure that the stress scenarios capture material risks as well as
reect possible extreme market moves that could arise as a result of market conditions and the operating environment.
The business and capital plans and the stress testing results of certain key group entities are integrated into the internal
capital adequacy assessment process.
Based on the internal capital adequacy assessment process, the Bank determines the level of capital that needs to be
maintained by considering the following in an integrated manner:
strategic focus, business plan and growth objectives;
regulatory capital requirements as per RBI guidelines;
assessment of material risks and impact of stress testing;
future strategy with regard to investments or divestments in subsidiaries; and
evaluation of options to raise capital from domestic and overseas markets, as permitted by RBI from time to time.
The Bank continues to monitor relevant developments and believes that its current robust capital adequacy position and
demonstrated track record of access to domestic and overseas markets for capital raising will enable it to maintain the
necessary levels of capital as required by regulations while continuing to grow its business.
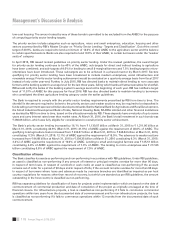
ASSET QUALITY AND COMPOSITION
Loan concentration
The Bank follows a policy of portfolio diversication and evaluate its total nancing exposure to a particular industry in
light of its forecasts of growth and protability for that industry. The Bank’s Credit Risk Management Group monitors all
major sectors of the economy and specically tracks industries in which the Bank has credit exposures. The Bank monitors
developments in various sectors to assess potential risks in our portfolio and new business opportunities. The Bank’s policy
is to limit its exposure to any particular industry, except for the retail nance segment, to 15.0% of its total exposure.
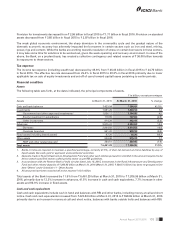
The following table sets forth, at the dates indicated, the composition of the Bank’s gross advances (net of write-offs).
` in billion, except percentages
March 31, 2015 March 31, 2016
Total
avances
% of total
advances
Total
advances
% of total
advances
Retail nance1, 2 ` 1,736.27 43.5% ` 2,130.70 47.3%
Power 248.07 6.2 273.32 6.1
Road, ports, telecom, urban development and other
infrastructure 244.96 6.1 268.49 6.0
Iron/steel and products 221.17 5.6 256.54 5.7
Services – non-nance 233.13 5.8 229.64 5.1
Services – nance 129.25 3.2 143.30 3.2
Wholesale/retail trade 116.59 2.9 126.86 2.8
Construction 99.98 2.5 104.97 2.3
Metal & products (excluding iron & steel) 92.26 2.3 99.71 2.2
Cement 91.31 2.3 85.66 1.9
Crude petroleum/rening and petrochemicals 114.56 2.9 77.41 1.7
Mining 71.10 1.8 73.79 1.7
Food and beverages 61.69 1.6 67.42 1.5
Electronics and engineering 69.22 1.7 67.02 1.5
Shipping 66.03 1.7 59.07 1.3
Manufacturing products (excluding metal) 34.98 0.9 41.88 0.9
Other industries3359.05 9.0 396.05 8.8
Total ` 3,989.62 100.0% ` 4,501.83 100.0%