ICICI Bank 2016 Annual Report Download - page 115
Download and view the complete annual report
Please find page 115 of the 2016 ICICI Bank annual report below. You can navigate through the pages in the report by either clicking on the pages listed below, or by using the keyword search tool below to find specific information within the annual report.-
 1
1 -
2
-
3
-
4
-
5
-
6
-
7
-
8
-
9
-
10
-
11
-
12
-
13
-
14
-
15
-
16
-
17
-
18
-
19
-
20
-
21
-
22
-
23
-
24
-
25
-
26
-
27
-
28
-
29
-
30
-
31
-
32
-
33
-
34
-
35
-
36
-
37
-
38
-
39
-
40
-
41
-
42
-
43
-
44
-
45
-
46
-
47
-
48
-
49
-
50
-
51
-
52
-
53
-
54
-
55
-
56
-
57
-
58
-
59
-
60
-
61
-
62
-
63
-
64
-
65
-
66
-
67
-
68
-
69
-
70
-
71
-
72
-
73
-
74
-
75
-
76
-
77
-
78
-
79
-
80
-
81
-
82
-
83
-
84
-
85
-
86
-
87
-
88
-
89
-
90
-
91
-
92
-
93
-
94
-
95
-
96
-
97
-
98
-
99
-
100
-
101
-
102
-
103
-
104
-
 105
105 -
 106
106 -
 107
107 -
 108
108 -
 109
109 -
 110
110 -
 111
111 -
 112
112 -
 113
113 -
 114
114 -
 115
115 -
 116
116 -
 117
117 -
 118
118 -
 119
119 -
 120
120 -
 121
121 -
 122
122 -
 123
123 -
 124
124 -
 125
125 -
126
-
127
-
128
-
129
-
130
-
131
-
132
-
133
-
134
-
135
-
136
-
137
-
138
-
139
-
140
-
141
-
142
-
143
-
144
-
145
-
146
-
147
-
148
-
149
-
150
-
151
-
152
-
153
-
154
-
155
-
156
-
157
-
158
-
159
-
160
-
161
-
162
-
163
-
164
-
165
-
166
-
167
-
168
-
169
-
170
-
171
-
172
-
173
-
174
-
175
-
176
-
177
-
178
-
179
-
180
-
181
-
182
-
183
-
184
-
185
-
186
-
187
-
188
-
189
-
190
-
191
-
192
-
193
-
194
-
195
-
196
-
197
-
198
-
199
-
200
-
201
-
202
-
203
-
204
-
205
-
206
-
207
-
208
-
209
-
210
-
211
-
212
-
213
-
214
-
215
-
216
-
217
-
218
-
219
-
220
-
221
-
222
-
223
-
224
-
225
-
226
-
227
-
228
-
229
-
230
-
231
-
232
-
233
-
234
-
235
-
236
-
237
-
238
-
239
-
240
-
241
-
242
-
243
-
244
-
245
-
246
-
247
-
248
-
249
-
250
-
251
-
252
 |
 |

113Annual Report 2015-2016
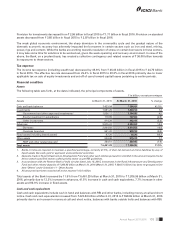
loans amounting to ` 53.00 billion slipped into the non-performing category as compared to slippages of ` 45.29 billion
during scal 2015. The net outstanding loans to borrowers whose facilities have been restructured decreased from
` 110.17 billion at March 31, 2015 to ` 85.73 billion at March 31, 2016.
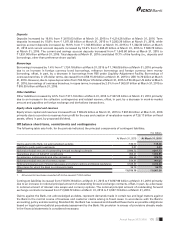
In scal 2016, RBI issued guidelines on Strategic Debt Restructuring (SDR) under which conversion of debt into equity
and acquisition of majority ownership of the borrower by banks is allowed. At March 31, 2016 the Bank had outstanding
SDR loans of ` 29.33 billion comprising primarily loans already classied as non-performing loans or restructured loans.
Further, in scal 2015, RBI had issued guidelines permitting banks to renance long-term project loans to infrastructure
and other core industries at periodic intervals without such renancing being considered as restructuring. Accordingly,
the outstanding portfolio of such loans for which renancing under the 5/25 scheme has been implemented was ` 42.39
billion at March 31, 2016.
The Bank’s aggregate net investments in security receipts including application money issued by asset reconstruction
companies were ` 7.91 billion at March 31, 2016 as compared to ` 8.41 billion at March 31, 2015.
At March 31, 2016, the total general provision held against standard assets including general provision on restructured
assets was ` 26.58 billion.
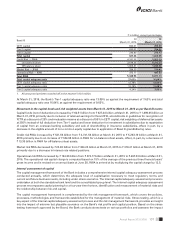
There are uncertainties in respect of certain sectors due to the weak global economic environment, sharp downturn in the
commodity cycle, gradual nature of the domestic economic recovery and high leverage. The key sectors that have been
impacted include power, mining, iron and steel, cement and rigs. At March 31, 2016, the Bank’s exposure (comprising
fund-based limits and non-fund based outstanding) to companies internally rated below investment grade (excluding
borrowers classied as non-performing or restructured) was ` 119.60 billion (1.3% of the Bank’s total exposure) in power
sector, ` 90.11 billion (1.0%) in mining sector, ` 77.76 billion (0.8%) in iron & steel sector, ` 66.43 billion (0.7%) in cement
sector and ` 25.13 billion (0.3%) in rigs sector. Further, the Bank’s exposure (comprising fund-based limits and non-fund
based outstanding) to promoter entities internally rated below investment grade where the underlying is partly linked to
these sectors was ` 61.62 billion (0.7%). In view of the uncertainties relating to these sectors and the time that it may take
to resolve exposures to these sectors, the Bank on a prudent basis made a collective contingency and related reserve
of ` 36.00 billion towards its exposures to these sectors. This reserve is over and above the provisions required for non-
performing and restructured loans as per RBI guidelines. There can be no assurance that this reserve would be adequate
to cover any future provisioning requirements in respect of these exposures or that non-performing loans will not arise
from other sectors.
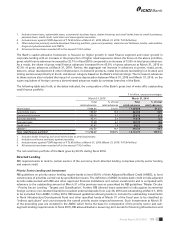
Segment information
RBI in its guidelines on “segmental reporting” has stipulated specied business segments and their denitions, for the
purposes of public disclosures on business information for banks in India.
The standalone segmental report for scal 2016, based on the segments identied and dened by RBI, has been presented
as follows:
Retail Banking includes exposures of the Bank, which satisfy the four qualifying criteria of ‘regulatory retail portfolio’
as stipulated by RBI guidelines on the Basel III framework.
Wholesale Banking includes all advances to trusts, partnership rms, companies and statutory bodies, by the Bank
which are not included in the Retail Banking segment, as per RBI guidelines for the Bank.
Treasury includes the entire investment portfolio of the Bank.
Other Banking includes leasing operations and other items not attributable to any particular business segment of the
Bank.
Framework for transfer pricing
All liabilities are transfer priced to a central treasury unit, which pools all funds and lends to the business units at
appropriate rates based on the relevant maturity of assets being funded after adjusting for regulatory reserve requirement
and directed lending requirements.