ICICI Bank 2016 Annual Report Download - page 209
Download and view the complete annual report
Please find page 209 of the 2016 ICICI Bank annual report below. You can navigate through the pages in the report by either clicking on the pages listed below, or by using the keyword search tool below to find specific information within the annual report.-
 1
1 -
2
-
3
-
4
-
5
-
6
-
7
-
8
-
9
-
10
-
11
-
12
-
13
-
14
-
15
-
16
-
17
-
18
-
19
-
20
-
21
-
22
-
23
-
24
-
25
-
26
-
27
-
28
-
29
-
30
-
31
-
32
-
33
-
34
-
35
-
36
-
37
-
38
-
39
-
40
-
41
-
42
-
43
-
44
-
45
-
46
-
47
-
48
-
49
-
50
-
51
-
52
-
53
-
54
-
55
-
56
-
57
-
58
-
59
-
60
-
61
-
62
-
63
-
64
-
65
-
66
-
67
-
68
-
69
-
70
-
71
-
72
-
73
-
74
-
75
-
76
-
77
-
78
-
79
-
80
-
81
-
82
-
83
-
84
-
85
-
86
-
87
-
88
-
89
-
90
-
91
-
92
-
93
-
94
-
95
-
96
-
97
-
98
-
99
-
100
-
101
-
102
-
103
-
104
-
105
-
106
-
107
-
108
-
109
-
110
-
111
-
112
-
113
-
114
-
115
-
116
-
117
-
118
-
119
-
120
-
121
-
122
-
123
-
124
-
125
-
126
-
127
-
128
-
129
-
130
-
131
-
132
-
133
-
134
-
135
-
136
-
137
-
138
-
139
-
140
-
141
-
142
-
143
-
144
-
145
-
146
-
147
-
148
-
149
-
150
-
151
-
152
-
153
-
154
-
155
-
156
-
157
-
158
-
159
-
160
-
161
-
162
-
163
-
164
-
165
-
166
-
167
-
168
-
169
-
170
-
171
-
172
-
173
-
174
-
175
-
176
-
177
-
178
-
179
-
180
-
181
-
182
-
183
-
184
-
185
-
186
-
187
-
188
-
189
-
190
-
191
-
192
-
193
-
194
-
195
-
196
-
197
-
198
-
 199
199 -
 200
200 -
 201
201 -
 202
202 -
 203
203 -
 204
204 -
 205
205 -
 206
206 -
 207
207 -
 208
208 -
 209
209 -
 210
210 -
 211
211 -
 212
212 -
 213
213 -
 214
214 -
 215
215 -
 216
216 -
 217
217 -
 218
218 -
 219
219 -
220
-
221
-
222
-
223
-
224
-
225
-
226
-
227
-
228
-
229
-
230
-
231
-
232
-
233
-
234
-
235
-
236
-
237
-
238
-
239
-
240
-
241
-
242
-
243
-
244
-
245
-
246
-
247
-
248
-
249
-
250
-
251
-
252
 |
 |

Annual Report 2015-2016 207
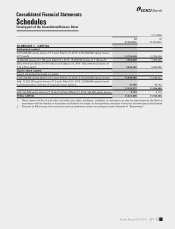
Schedules
forming part of the Consolidated Balance Sheet (Contd.)
Consolidated Financial Statements
` in ‘000s
At
31.03.2016
At
31.03.2015
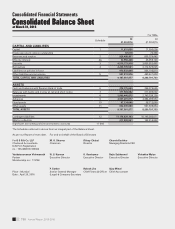
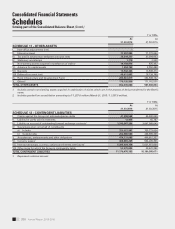
SCHEDULE 9 - ADVANCES [net of provisions]
A. i) Bills purchased and discounted 143,811,829 139,070,145
ii) Cash credits, overdrafts and loans repayable on demand 849,039,557 680,082,886
iii) Term loans 3,944,439,691 3,565,747,923
TOTAL ADVANCES 4,937,291,077 4,384,900,954
B. i) Secured by tangible assets (includes advances against book debts) 3,948,314,956 3,611,662,833
ii) Covered by bank/government guarantees 103,079,622 112,798,745
iii) Unsecured 885,896,499 660,439,376
TOTAL ADVANCES 4,937,291,077 4,384,900,954
C. I. Advances in India
i) Priority sector 924,348,694 762,092,862
ii) Public sector 44,329,101 35,374,080
iii) Banks 283,403 146,618
iv) Others 2,525,626,771 2,202,248,007
TOTAL ADVANCES IN INDIA 3,494,587,969 2,999,861,567
II. Advances outside India
i) Due from banks 18,204,673 12,899,084
ii) Due from others
a) Bills purchased and discounted 42,433,900 48,389,649
b) Syndicated and term loans 1,013,131,071 1,000,048,245
c) Others 368,933,464 323,702,409
TOTAL ADVANCES OUTSIDE INDIA 1,442,703,108 1,385,039,387
TOTAL ADVANCES 4,937,291,077 4,384,900,954
` in ‘000s
At
31.03.2016
At
31.03.2015
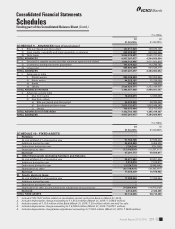
SCHEDULE 10 - FIXED ASSETS
I. Premises
At cost at March 31 of preceding year 51,764,728 47,929,434
Additions during the year1 29,609,849 4,464,603
Deductions during the year (724,254) (629,309)
Depreciation to date2 (13,358,550) (12,257,917)
Net block3 67,291,773 39,506,811
II. Other xed assets (including furniture and xtures)
At cost at March 31 of preceding year 55,271,663 50,801,492
Additions during the year 7,510,219 7,518,817
Deductions during the year (3,214,712) (3,048,646)
Depreciation to date4 (42,138,931) (38,392,681)
Net block 17,428,239 16,878,982
III. Assets given on lease
At cost at March 31 of preceding year 17,299,544 17,299,544
Additions during the year – –
Deductions during the year – –
Depreciation to date, accumulated lease adjustment and provisions5 (14,884,909) (14,973,248)
Net block 2,414,635 2,326,296
TOTAL FIXED ASSETS 87,134,646 58,712,089
1. Includes ` 28,174.7 million added on revaluation carried out by the Bank on March 31, 2016.
2. Includes depreciation charge amounting to ` 1,513.3 million (March 31, 2015: ` 1,558.5 million).
3. Includes assets of ` 13.6 million of the Bank (March 31, 2015: ` 2.0 million) which are held for sale.
4. Includes depreciation charge amounting to ` 6,725.6 million (March 31, 2015: ` 6,073.1 million).
5. Includes depreciation charge/lease adjustment amounting to ` 192.2 million (March 31, 2015: ` 350.6 million).