The Hartford 2007 Annual Report Download - page 99
Download and view the complete annual report
Please find page 99 of the 2007 The Hartford annual report below. You can navigate through the pages in the report by either clicking on the pages listed below, or by using the keyword search tool below to find specific information within the annual report.-
 1
1 -
2
-
3
-
4
-
5
-
6
-
7
-
8
-
9
-
10
-
11
-
12
-
13
-
14
-
15
-
16
-
17
-
18
-
19
-
20
-
21
-
22
-
23
-
24
-
25
-
26
-
27
-
28
-
29
-
30
-
31
-
32
-
33
-
34
-
35
-
36
-
37
-
38
-
39
-
40
-
41
-
42
-
43
-
44
-
45
-
46
-
47
-
48
-
49
-
50
-
51
-
52
-
53
-
54
-
55
-
56
-
57
-
58
-
59
-
60
-
61
-
62
-
63
-
64
-
65
-
66
-
67
-
68
-
69
-
70
-
71
-
72
-
73
-
74
-
75
-
76
-
77
-
78
-
79
-
80
-
81
-
82
-
83
-
84
-
85
-
86
-
87
-
88
-
 89
89 -
 90
90 -
 91
91 -
 92
92 -
 93
93 -
 94
94 -
 95
95 -
 96
96 -
 97
97 -
 98
98 -
 99
99 -
 100
100 -
 101
101 -
 102
102 -
 103
103 -
 104
104 -
 105
105 -
 106
106 -
 107
107 -
 108
108 -
 109
109 -
110
-
111
-
112
-
113
-
114
-
115
-
116
-
117
-
118
-
119
-
120
-
121
-
122
-
123
-
124
-
125
-
126
-
127
-
128
-
129
-
130
-
131
-
132
-
133
-
134
-
135
-
136
-
137
-
138
-
139
-
140
-
141
-
142
-
143
-
144
-
145
-
146
-
147
-
148
-
149
-
150
-
151
-
152
-
153
-
154
-
155
-
156
-
157
-
158
-
159
-
160
-
161
-
162
-
163
-
164
-
165
-
166
-
167
-
168
-
169
-
170
-
171
-
172
-
173
-
174
-
175
-
176
-
177
-
178
-
179
-
180
-
181
-
182
-
183
-
184
-
185
-
186
-
187
-
188
-
189
-
190
-
191
-
192
-
193
-
194
-
195
-
196
-
197
-
198
-
199
-
200
-
201
-
202
-
203
-
204
-
205
-
206
-
207
-
208
-
209
-
210
-
211
-
212
-
213
-
214
-
215
-
216
-
217
-
218
-
219
-
220
-
221
-
222
-
223
-
224
-
225
-
226
-
227
-
228
-
229
-
230
-
231
-
232
-
233
-
234
-
235
-
236
-
237
-
238
-
239
-
240
-
241
-
242
-
243
-
244
-
245
-
246
-
247
-
248
-
249
-
250
-
251
-
252
-
253
-
254
-
255
-
256
-
257
-
258
-
259
-
260
-
261
-
262
-
263
-
264
-
265
-
266
-
267
-
268
-
269
-
270
-
271
-
272
-
273
-
274
-
275
-
276
 |
 |

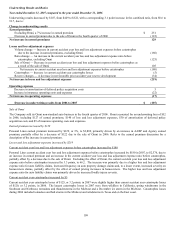
99
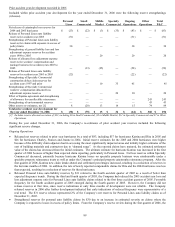
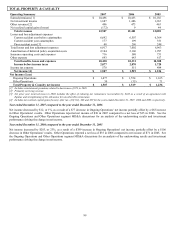
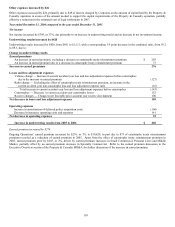
TOTAL PROPERTY & CASUALTY
Operating Summary 2007 2006 2005
Earned premiums [1] $ 10,496 $ 10,433 $ 10,156
Net investment income 1,687 1,486 1,365
Other revenues [2] 496 473 463
Net realized capital gains (losses) (172) 9 44
Total revenues 12,507 12,401 12,028
Losses and loss adjustment expenses
Current accident year before catastrophes 6,692 6,507 6,364
Current accident year catastrophes 177 199 351
Prior accident years [3] 48 296 248
Total losses and loss adjustment expenses 6,917 7,002 6,963
Amortization of deferred policy acquisition costs 2,104 2,106 1,997
Insurance operating costs and expenses 716 580 731
Other expense 693 643 617
Total benefits, losses and expenses 10,430 10,331 10,308
Income before income taxes 2,077 2,070 1,720
Income tax expense 570 551 484
Net income [4] $ 1,507 $ 1,519 $ 1,236
Net Income (Loss)
Ongoing Operations $ 1,477 $ 1,554 $ 1,165
Other Operations 30 (35) 71
Total Property & Casualty net income $ 1,507 $ 1,519 $ 1,236
[1] Includes reinstatement premiums related to hurricanes of $73 in 2005.
[2] Primarily servicing revenue.
[3] Net prior year incurred losses in 2006 includes the effect of reducing net reinsurance recoverables by $243 as a result of an agreement with
Equitas and strengthening of the allowance for uncollectible reinsurance.
[4] Includes net realized capital gains (losses), after tax, of $(112), $46 and $29 for the years ended December 31, 2007, 2006 and 2005, respectively.
Year ended December 31, 2007 compared to the year ended December 31, 2006
Net income decreased by $12, or 1%, as a result of a $77 decrease in Ongoing Operations’ net income partially offset by a $65 increase
in Other Operations’ results. Other Operations reported net income of $30 in 2007 compared to a net loss of $35 in 2006. See the
Ongoing Operations and Other Operations segment MD&A discussions for an analysis of the underwriting results and investment
performance driving the change in net income.
Year ended December 31, 2006 compared to the year ended December 31, 2005
Net income increased by $283, or 23%, as a result of a $389 increase in Ongoing Operations’ net income, partially offset by a $106
decrease in Other Operations’ results. Other Operations reported a net loss of $35 in 2006 compared to net income of $71 in 2005. See
the Ongoing Operations and Other Operations segment MD&A discussions for an analysis of the underwriting results and investment
performance driving the change in net income.