The Hartford 2007 Annual Report Download - page 41
Download and view the complete annual report
Please find page 41 of the 2007 The Hartford annual report below. You can navigate through the pages in the report by either clicking on the pages listed below, or by using the keyword search tool below to find specific information within the annual report.-
 1
1 -
2
-
3
-
4
-
5
-
6
-
7
-
8
-
9
-
10
-
11
-
12
-
13
-
14
-
15
-
16
-
17
-
18
-
19
-
20
-
21
-
22
-
23
-
24
-
25
-
26
-
27
-
28
-
29
-
30
-
 31
31 -
 32
32 -
 33
33 -
 34
34 -
 35
35 -
 36
36 -
 37
37 -
 38
38 -
 39
39 -
 40
40 -
 41
41 -
 42
42 -
 43
43 -
 44
44 -
 45
45 -
 46
46 -
 47
47 -
 48
48 -
 49
49 -
 50
50 -
 51
51 -
52
-
53
-
54
-
55
-
56
-
57
-
58
-
59
-
60
-
61
-
62
-
63
-
64
-
65
-
66
-
67
-
68
-
69
-
70
-
71
-
72
-
73
-
74
-
75
-
76
-
77
-
78
-
79
-
80
-
81
-
82
-
83
-
84
-
85
-
86
-
87
-
88
-
89
-
90
-
91
-
92
-
93
-
94
-
95
-
96
-
97
-
98
-
99
-
100
-
101
-
102
-
103
-
104
-
105
-
106
-
107
-
108
-
109
-
110
-
111
-
112
-
113
-
114
-
115
-
116
-
117
-
118
-
119
-
120
-
121
-
122
-
123
-
124
-
125
-
126
-
127
-
128
-
129
-
130
-
131
-
132
-
133
-
134
-
135
-
136
-
137
-
138
-
139
-
140
-
141
-
142
-
143
-
144
-
145
-
146
-
147
-
148
-
149
-
150
-
151
-
152
-
153
-
154
-
155
-
156
-
157
-
158
-
159
-
160
-
161
-
162
-
163
-
164
-
165
-
166
-
167
-
168
-
169
-
170
-
171
-
172
-
173
-
174
-
175
-
176
-
177
-
178
-
179
-
180
-
181
-
182
-
183
-
184
-
185
-
186
-
187
-
188
-
189
-
190
-
191
-
192
-
193
-
194
-
195
-
196
-
197
-
198
-
199
-
200
-
201
-
202
-
203
-
204
-
205
-
206
-
207
-
208
-
209
-
210
-
211
-
212
-
213
-
214
-
215
-
216
-
217
-
218
-
219
-
220
-
221
-
222
-
223
-
224
-
225
-
226
-
227
-
228
-
229
-
230
-
231
-
232
-
233
-
234
-
235
-
236
-
237
-
238
-
239
-
240
-
241
-
242
-
243
-
244
-
245
-
246
-
247
-
248
-
249
-
250
-
251
-
252
-
253
-
254
-
255
-
256
-
257
-
258
-
259
-
260
-
261
-
262
-
263
-
264
-
265
-
266
-
267
-
268
-
269
-
270
-
271
-
272
-
273
-
274
-
275
-
276
 |
 |

41
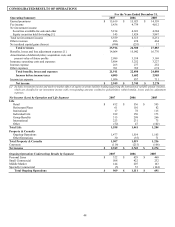
Life Estimated Gross Profits Used in the Valuation and Amortization of Assets and Liabilities Associated with Variable Annuity and
Other Universal Life-Type Contracts
Accounting Policy and Assumptions
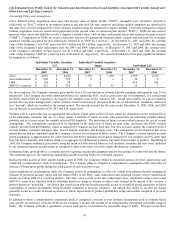
Life’ s deferred policy acquisition costs asset and present value of future profits (“PVFP”) intangible asset (hereafter, referred to
collectively as “DAC”) related to investment contracts and universal life-type contracts (including variable annuities) are amortized in
the same way, over the estimated life of the contracts acquired using the retrospective deposit method. Under the retrospective deposit
method, acquisition costs are amortized in proportion to the present value of estimated gross profits (“EGPs”). EGPs are also used to
amortize other assets and liabilities on the Company’ s balance sheet, such as sales inducement assets and unearned revenue reserves
(“URR”). Components of EGPs are used to determine reserves for guaranteed minimum death, income and universal life secondary
guarantee benefits accounted for and collectively referred to as “SOP 03-1 reserves”. At December 31, 2007 and 2006, the carrying
value of the Company’ s Life DAC asset was $10.5 billion and $9.1 billion, respectively. At December 31, 2007 and 2006, the carrying
value of the Company’ s sales inducement asset was $467 and $404, respectively. At December 31, 2007 and 2006, the carrying value
of the Company’ s unearned revenue reserve was $1.2 billion and $842, respectively. At December 31, 2007 and 2006, the carrying
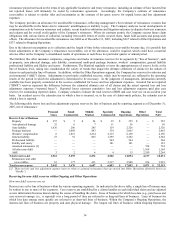
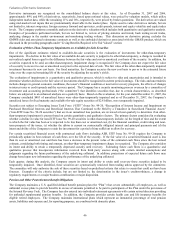
value of the Company’s SOP 03-1 reserves were $590 and $517, respectively. The specific breakdown of the most significant balances
by segment are as follows:
Individual Variable Annuities –
U.S.
Individual Variable Annuities -
Japan
Individual Life
December 31,
2007
December 31,
2006
December 31,
2007
December 31,
2006
December 31,
2007
December 31,
2006
DAC $ 4,982 $ 4,420 $ 1,760 $ 1,430 $ 2,309 $ 2,013
Sales Inducements $ 390 $ 352 $ 8 $ 2 $ 20 $ 8
URR $ 124 $ 98 $ — $ — $ 816 $ 605
SOP 03-1 reserves $ 527 $ 475 $ 42 $ 35 $ 19 $ 7
For most contracts, the Company estimates gross profits over a 20 year horizon as estimated profits emerging subsequent to year 20 are
immaterial. The Company uses other amortization bases for amortizing DAC, such as gross costs (net of reinsurance), as a replacement
for EGPs when EGPs are expected to be negative for multiple years of the contract’ s life. Actual gross profits, in a given reporting
period, that vary from management’ s initial estimates result in increases or decreases in the rate of amortization, commonly referred to
as a “true-up”, which are recorded in the current period. The true-up recorded for the years ended December 31, 2007, 2006, and 2005
was an increase to amortization of $3, $41, and $18, respectively.
Products sold in a particular year are aggregated into cohorts. Future gross profits for each cohort are projected over the estimated lives
of the underlying contracts, and are, to a large extent, a function of future account value projections for individual variable annuity
products and to a lesser extent for variable universal life products. The projection of future account values requires the use of certain
assumptions. The assumptions considered to be important in the projection of future account value, and hence the EGPs, include
separate account fund performance, which is impacted by separate account fund mix, less fees assessed against the contract holder’s
account balance, surrender and lapse rates, interest margin, mortality, and hedging costs. The assumptions are developed as part of an
annual process and are dependent upon the Company’ s current best estimates of future events. The Company’ s current separate account
return assumption is approximately 8% (after fund fees, but before mortality and expense charges) for U.S. products and 5% (after fund
fees, but before mortality and expense charges) in aggregate for all Japanese products, but varies from product to product. Beginning in
2007, the Company estimated gross profits using the mean of EGPs derived from a set of stochastic scenarios that have been calibrated
to our estimated separate account return as compared to prior years where we used a single deterministic estimation.
Estimating future gross profits is a complex process requiring considerable judgment and the forecasting of events well into the future.
The estimation process, the underlying assumptions and the resulting EGPs, are evaluated regularly.
During the third quarter of 2007 and the fourth quarter of 2006, the Company refined its estimation process for DAC amortization and
completed a comprehensive study of assumptions. The Company plans to complete a comprehensive assumption study and refine its
estimate of future gross profits during the third quarter of each successive year.
Upon completion of an assumption study, the Company revises its assumptions to reflect its current best estimate, thereby changing its
estimate of projected account values and the related EGPs in the DAC, sales inducement and unearned revenue reserve amortization
models as well as SOP 03-1 reserving models. The DAC asset as well as the sales inducement asset, unearned revenue reserves and
SOP 03-1 reserves are adjusted with an offsetting benefit or charge to income to reflect such changes in the period of the revision, a
process known as “unlocking”. An unlock that results in an after-tax benefit generally occurs as a result of actual experience or future
expectations of product profitability being favorable compared to previous estimates. An unlock that results in an after-tax charge
generally occurs as a result of actual experience or future expectations of product profitability being unfavorable compared to previous
estimates.
In addition to when a comprehensive assumption study is completed, revisions to best estimate assumptions used to estimate future
gross profits are necessary when the EGPs in the Company’s models fall outside of an independently determined reasonable range of
EGPs. The Company performs a quantitative process each quarter to determine the reasonable range of EGPs. This process involves