The Hartford 2007 Annual Report Download - page 81
Download and view the complete annual report
Please find page 81 of the 2007 The Hartford annual report below. You can navigate through the pages in the report by either clicking on the pages listed below, or by using the keyword search tool below to find specific information within the annual report.-
 1
1 -
2
-
3
-
4
-
5
-
6
-
7
-
8
-
9
-
10
-
11
-
12
-
13
-
14
-
15
-
16
-
17
-
18
-
19
-
20
-
21
-
22
-
23
-
24
-
25
-
26
-
27
-
28
-
29
-
30
-
31
-
32
-
33
-
34
-
35
-
36
-
37
-
38
-
39
-
40
-
41
-
42
-
43
-
44
-
45
-
46
-
47
-
48
-
49
-
50
-
51
-
52
-
53
-
54
-
55
-
56
-
57
-
58
-
59
-
60
-
61
-
62
-
63
-
64
-
65
-
66
-
67
-
68
-
69
-
70
-
 71
71 -
 72
72 -
 73
73 -
 74
74 -
 75
75 -
 76
76 -
 77
77 -
 78
78 -
 79
79 -
 80
80 -
 81
81 -
 82
82 -
 83
83 -
 84
84 -
 85
85 -
 86
86 -
 87
87 -
 88
88 -
 89
89 -
 90
90 -
 91
91 -
92
-
93
-
94
-
95
-
96
-
97
-
98
-
99
-
100
-
101
-
102
-
103
-
104
-
105
-
106
-
107
-
108
-
109
-
110
-
111
-
112
-
113
-
114
-
115
-
116
-
117
-
118
-
119
-
120
-
121
-
122
-
123
-
124
-
125
-
126
-
127
-
128
-
129
-
130
-
131
-
132
-
133
-
134
-
135
-
136
-
137
-
138
-
139
-
140
-
141
-
142
-
143
-
144
-
145
-
146
-
147
-
148
-
149
-
150
-
151
-
152
-
153
-
154
-
155
-
156
-
157
-
158
-
159
-
160
-
161
-
162
-
163
-
164
-
165
-
166
-
167
-
168
-
169
-
170
-
171
-
172
-
173
-
174
-
175
-
176
-
177
-
178
-
179
-
180
-
181
-
182
-
183
-
184
-
185
-
186
-
187
-
188
-
189
-
190
-
191
-
192
-
193
-
194
-
195
-
196
-
197
-
198
-
199
-
200
-
201
-
202
-
203
-
204
-
205
-
206
-
207
-
208
-
209
-
210
-
211
-
212
-
213
-
214
-
215
-
216
-
217
-
218
-
219
-
220
-
221
-
222
-
223
-
224
-
225
-
226
-
227
-
228
-
229
-
230
-
231
-
232
-
233
-
234
-
235
-
236
-
237
-
238
-
239
-
240
-
241
-
242
-
243
-
244
-
245
-
246
-
247
-
248
-
249
-
250
-
251
-
252
-
253
-
254
-
255
-
256
-
257
-
258
-
259
-
260
-
261
-
262
-
263
-
264
-
265
-
266
-
267
-
268
-
269
-
270
-
271
-
272
-
273
-
274
-
275
-
276
 |
 |
81
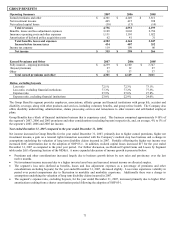
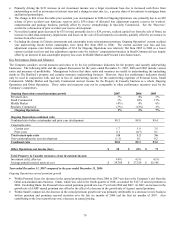
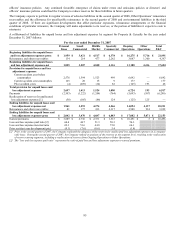
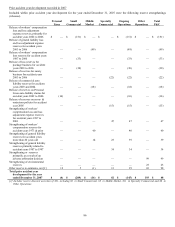
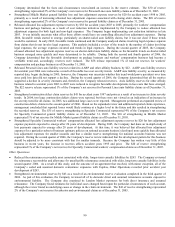
Ongoing Operations combined ratio
• For 2006, the combined ratio before catastrophes and prior accident year development decreased by 1.4 points, to 88.0, driven
largely by the effect of $73 of catastrophe treaty reinstatement premium recorded as a reduction of earned premium in 2005 and an
improvement in the expense ratio. Before the effect of reinstatement premium in 2005, the combined ratio before catastrophes and
prior accident year development decreased by 0.7 points, primarily due to a 0.8 point decrease in the expense ratio and a lower
current accident year loss and loss adjustment expense ratio for workers’ compensation business in Small Commercial, partially
offset by an increase in non-catastrophe property loss costs in Middle Market and Personal Lines homeowners. The decrease in the
expense ratio was primarily driven by a reduction of $41 for Citizens’ assessments in 2006 and a charge of $64 for Citizens
assessments in 2005.
• The decrease in the current accident year catastrophe ratio for 2006 was primarily due to $264 of net losses incurred in 2005 for
hurricanes Katrina, Rita and Wilma, partially offset by an increase in non-hurricane catastrophe losses. Catastrophe losses for 2006
included tornadoes and hail storms in the Midwest and windstorms in Texas and on the East coast.
• Prior accident year catastrophe reserves were reduced by $70 in 2006, primarily due to $83 of favorable development related to the
2005 and 2004 hurricanes. Net prior accident year development for non-catastrophe claims was not significant as reserve
strengthenings were largely offset by reserve releases. See the “Reserves” section for a discussion of prior accident year reserve
development for Ongoing Operations in 2006.
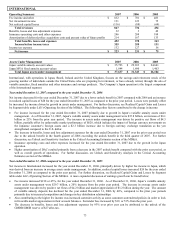
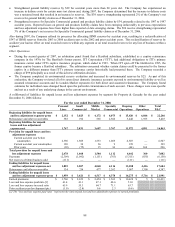
Other Operations net income (loss)
• Other Operations reported a net loss of $35 for 2006 compared to net income of $71 for 2005. The change from net income to a net
loss was primarily due to a $148 increase in unfavorable prior accident year development and a $22 decrease in net investment
income, partially offset by a change to an income tax benefit in 2006 as a result of a pre-tax loss in 2006. The $148 increase in
prior accident year development was primarily due to a $243 reduction in net reinsurance recoverables as a result of the agreement
with Equitas and the Company’ s evaluation of the reinsurance recoverables and allowance for uncollectible reinsurance associated
with older, long-term casualty liabilities. Partially offsetting the increase in prior accident year development in 2006 was $85 of
unfavorable reserve development for assumed reinsurance in 2005. The $22 decrease in net investment income was primarily due
to lower invested assets as a result of loss and loss adjustment expense payments and the reallocation of capital from Other
Operations to Ongoing Operations.
Investment yield and average invested assets
• The after-tax investment yield remained flat at 4.1% from 2005 to 2006. An increase in the yield on investments in fixed maturities
was offset by a decrease in the yield on limited partnerships.
• The average annual invested assets at cost increased as a result of net underwriting cash inflows and investment income.
How Property & Casualty seeks to earn income
Net income is a measure of profit or loss used in evaluating the performance of Total Property & Casualty and the Ongoing Operations
and Other Operations segments. Within Ongoing Operations, the underwriting segments of Personal Lines, Small Commercial, Middle
Market and Specialty Commercial are evaluated by The Hartford’ s management primarily based upon underwriting results.
Underwriting results within Ongoing Operations are influenced significantly by earned premium growth and the adequacy of the
Company's pricing. Underwriting profitability over time is also greatly influenced by the Company's underwriting discipline, which
seeks to manage exposure to loss through favorable risk selection and diversification, its management of claims, its use of reinsurance
and its ability to manage its expense ratio which it accomplishes through economies of scale and its management of acquisition costs
and other underwriting expenses.
Pricing adequacy depends on a number of factors, including the ability to obtain regulatory approval for rate changes, proper evaluation
of underwriting risks, the ability to project future loss cost frequency and severity based on historical loss experience adjusted for known
trends, the Company’ s response to rate actions taken by competitors, and expectations about regulatory and legal developments and
expense levels. Property & Casualty seeks to price its insurance policies such that insurance premiums and future net investment
income earned on premiums received will cover underwriting expenses and the ultimate cost of paying claims reported on the policies
and provide for a profit margin. For many of its insurance products, Property & Casualty is required to obtain approval for its premium
rates from state insurance departments.
In setting its pricing, Property & Casualty assumes an expected level of losses from natural or man-made catastrophes that will cover the
Company's exposure to catastrophes over the long-term. In most years, however, Property & Casualty's actual losses from catastrophes
will be more or less than that assumed in its pricing due to the significant volatility of catastrophe losses. ISO defines a catastrophe loss
as an event that causes $25 or more in industry insured property losses and affects a significant number of property and casualty
policyholders and insurers.
Given the lag in the period from when claims are incurred to when they are reported and paid, final claim settlements may vary from
current estimates of incurred losses and loss expenses, particularly when those payments may not occur until well into the future.
Reserves for lines of business with a longer lag (or “tail”) in reporting are more difficult to estimate. Reserve estimates for longer tail
lines are initially set based on loss and loss expense ratio assumptions estimated when the business was priced and are adjusted as the
paid and reported claims develop, indicating that the ultimate loss and loss expense ratio will differ from the initial assumptions.