The Hartford 2007 Annual Report Download - page 83
Download and view the complete annual report
Please find page 83 of the 2007 The Hartford annual report below. You can navigate through the pages in the report by either clicking on the pages listed below, or by using the keyword search tool below to find specific information within the annual report.-
 1
1 -
2
-
3
-
4
-
5
-
6
-
7
-
8
-
9
-
10
-
11
-
12
-
13
-
14
-
15
-
16
-
17
-
18
-
19
-
20
-
21
-
22
-
23
-
24
-
25
-
26
-
27
-
28
-
29
-
30
-
31
-
32
-
33
-
34
-
35
-
36
-
37
-
38
-
39
-
40
-
41
-
42
-
43
-
44
-
45
-
46
-
47
-
48
-
49
-
50
-
51
-
52
-
53
-
54
-
55
-
56
-
57
-
58
-
59
-
60
-
61
-
62
-
63
-
64
-
65
-
66
-
67
-
68
-
69
-
70
-
71
-
72
-
 73
73 -
 74
74 -
 75
75 -
 76
76 -
 77
77 -
 78
78 -
 79
79 -
 80
80 -
 81
81 -
 82
82 -
 83
83 -
 84
84 -
 85
85 -
 86
86 -
 87
87 -
 88
88 -
 89
89 -
 90
90 -
 91
91 -
 92
92 -
 93
93 -
94
-
95
-
96
-
97
-
98
-
99
-
100
-
101
-
102
-
103
-
104
-
105
-
106
-
107
-
108
-
109
-
110
-
111
-
112
-
113
-
114
-
115
-
116
-
117
-
118
-
119
-
120
-
121
-
122
-
123
-
124
-
125
-
126
-
127
-
128
-
129
-
130
-
131
-
132
-
133
-
134
-
135
-
136
-
137
-
138
-
139
-
140
-
141
-
142
-
143
-
144
-
145
-
146
-
147
-
148
-
149
-
150
-
151
-
152
-
153
-
154
-
155
-
156
-
157
-
158
-
159
-
160
-
161
-
162
-
163
-
164
-
165
-
166
-
167
-
168
-
169
-
170
-
171
-
172
-
173
-
174
-
175
-
176
-
177
-
178
-
179
-
180
-
181
-
182
-
183
-
184
-
185
-
186
-
187
-
188
-
189
-
190
-
191
-
192
-
193
-
194
-
195
-
196
-
197
-
198
-
199
-
200
-
201
-
202
-
203
-
204
-
205
-
206
-
207
-
208
-
209
-
210
-
211
-
212
-
213
-
214
-
215
-
216
-
217
-
218
-
219
-
220
-
221
-
222
-
223
-
224
-
225
-
226
-
227
-
228
-
229
-
230
-
231
-
232
-
233
-
234
-
235
-
236
-
237
-
238
-
239
-
240
-
241
-
242
-
243
-
244
-
245
-
246
-
247
-
248
-
249
-
250
-
251
-
252
-
253
-
254
-
255
-
256
-
257
-
258
-
259
-
260
-
261
-
262
-
263
-
264
-
265
-
266
-
267
-
268
-
269
-
270
-
271
-
272
-
273
-
274
-
275
-
276
 |
 |
83
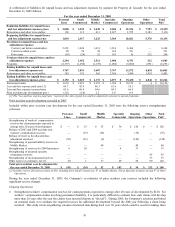
The loss and loss adjustment expense ratio is affected by claim frequency and claim severity, particularly for shorter-tail property lines
of business, where the emergence of claim frequency and severity is credible and likely indicative of ultimate losses. Claim frequency
represents the percentage change in the average number of reported claims per unit of exposure in the current accident year compared to
that of the previous accident year. Claim severity represents the percentage change in the estimated average cost per claim in the current
accident year compared to that of the previous accident year. As one of the factors used to determine pricing, the Company’ s practice is
to first make an overall assumption about claim frequency and severity for a given line of business and then, as part of the ratemaking
process, adjust the assumption as appropriate for the particular state, product or coverage.
Current accident year loss and loss adjustment expense ratio before catastrophes
The current accident year loss and loss adjustment expense ratio before catastrophes is a measure of the cost of non-catastrophe claims
incurred in the current accident year divided by earned premiums. Management believes that the current accident year loss and loss
adjustment expense ratio before catastrophes is a performance measure that is useful to investors as it removes the impact of volatile and
unpredictable catastrophe losses and prior accident year reserve development.
Current accident year catastrophe ratio
The current accident year catastrophe ratio represents the ratio of catastrophe losses (net of reinsurance) to earned premiums for
catastrophe claims incurred during the current accident year. A catastrophe is an event that causes $25 or more in industry insured
property losses and affects a significant number of property and casualty policyholders and insurers. The catastrophe ratio includes the
effect of catastrophe losses, but does not include the effect of reinstatement premiums.
Prior accident year loss and loss adjustment expense ratio
The prior year loss and loss adjustment expense ratio represents the increase (decrease) in the estimated cost of settling catastrophe and
non-catastrophe claims incurred in prior accident years as recorded in the current calendar year divided by earned premiums.
Expense ratio
The expense ratio is the ratio of underwriting expenses, excluding bad debt expense, to earned premiums. Underwriting expenses
include the amortization of deferred policy acquisition costs and insurance operating costs and expenses. Deferred policy acquisition
costs include commissions, taxes, licenses and fees and other underwriting expenses and are amortized over the policy term.
Policyholder dividend ratio
The policyholder dividend ratio is the ratio of policyholder dividends to earned premium.
Combined ratio
The combined ratio is the sum of the loss and loss adjustment expense ratio, the expense ratio and the policyholder dividend ratio. This
ratio is a relative measurement that describes the related cost of losses and expenses for every $100 of earned premiums. A combined
ratio below 100.0 demonstrates underwriting profit; a combined ratio above 100.0 demonstrates underwriting losses.
Catastrophe ratio
The catastrophe ratio (a component of the loss and loss adjustment expense ratio) represents the ratio of catastrophe losses (net of
reinsurance) to earned premiums. By their nature, catastrophe losses vary dramatically from year to year. Based on the mix and
geographic dispersion of premium written and estimates derived from various catastrophe loss models, the Company’ s expected
catastrophe ratio over the long-term is 3.0 to 3.5 points. See “Risk Management Strategy” below for a discussion of the Company’ s
catastrophe risk management program that serves to mitigate the Company’ s net exposure to catastrophe losses. The catastrophe ratio
includes the effect of catastrophe losses, but does not include the effect of reinstatement premiums.
Combined ratio before catastrophes and prior accident year development
The combined ratio before catastrophes and prior accident year development represents the combined ratio for the current accident year,
excluding the impact of catastrophes. The Company believes this ratio is an important measure of the trend in profitability since it
removes the impact of volatile and unpredictable catastrophe losses and prior accident year reserve development.
Underwriting results
Underwriting results is a before-tax measure that represents earned premiums less incurred losses, loss adjustment expenses and
underwriting expenses. The Hartford believes that underwriting results provides investors with a valuable measure of before-tax
profitability derived from underwriting activities, which are managed separately from the Company’ s investing activities. Underwriting
results is also presented for Ongoing Operations and Other Operations. A reconciliation of underwriting results to net income for
Ongoing Operations and Other Operations is set forth in their respective discussions herein.
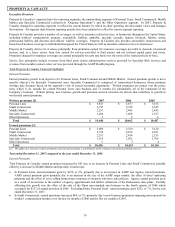
Investment yield
The investment yield, or return, on the Company’ s invested assets primarily includes interest income on fixed maturity investments.
Based upon the fair value of Property & Casualty’ s investments as of December 31, 2007 and 2006, approximately 89% and 91%,
respectively, of invested assets were held in fixed maturities. A number of factors affect the yield on fixed maturity investments,