The Hartford 2007 Annual Report Download - page 155
Download and view the complete annual report
Please find page 155 of the 2007 The Hartford annual report below. You can navigate through the pages in the report by either clicking on the pages listed below, or by using the keyword search tool below to find specific information within the annual report.-
 1
1 -
2
-
3
-
4
-
5
-
6
-
7
-
8
-
9
-
10
-
11
-
12
-
13
-
14
-
15
-
16
-
17
-
18
-
19
-
20
-
21
-
22
-
23
-
24
-
25
-
26
-
27
-
28
-
29
-
30
-
31
-
32
-
33
-
34
-
35
-
36
-
37
-
38
-
39
-
40
-
41
-
42
-
43
-
44
-
45
-
46
-
47
-
48
-
49
-
50
-
51
-
52
-
53
-
54
-
55
-
56
-
57
-
58
-
59
-
60
-
61
-
62
-
63
-
64
-
65
-
66
-
67
-
68
-
69
-
70
-
71
-
72
-
73
-
74
-
75
-
76
-
77
-
78
-
79
-
80
-
81
-
82
-
83
-
84
-
85
-
86
-
87
-
88
-
89
-
90
-
91
-
92
-
93
-
94
-
95
-
96
-
97
-
98
-
99
-
100
-
101
-
102
-
103
-
104
-
105
-
106
-
107
-
108
-
109
-
110
-
111
-
112
-
113
-
114
-
115
-
116
-
117
-
118
-
119
-
120
-
121
-
122
-
123
-
124
-
125
-
126
-
127
-
128
-
129
-
130
-
131
-
132
-
133
-
134
-
135
-
136
-
137
-
138
-
139
-
140
-
141
-
142
-
143
-
144
-
 145
145 -
 146
146 -
 147
147 -
 148
148 -
 149
149 -
 150
150 -
 151
151 -
 152
152 -
 153
153 -
 154
154 -
 155
155 -
 156
156 -
 157
157 -
 158
158 -
 159
159 -
 160
160 -
 161
161 -
 162
162 -
 163
163 -
 164
164 -
 165
165 -
166
-
167
-
168
-
169
-
170
-
171
-
172
-
173
-
174
-
175
-
176
-
177
-
178
-
179
-
180
-
181
-
182
-
183
-
184
-
185
-
186
-
187
-
188
-
189
-
190
-
191
-
192
-
193
-
194
-
195
-
196
-
197
-
198
-
199
-
200
-
201
-
202
-
203
-
204
-
205
-
206
-
207
-
208
-
209
-
210
-
211
-
212
-
213
-
214
-
215
-
216
-
217
-
218
-
219
-
220
-
221
-
222
-
223
-
224
-
225
-
226
-
227
-
228
-
229
-
230
-
231
-
232
-
233
-
234
-
235
-
236
-
237
-
238
-
239
-
240
-
241
-
242
-
243
-
244
-
245
-
246
-
247
-
248
-
249
-
250
-
251
-
252
-
253
-
254
-
255
-
256
-
257
-
258
-
259
-
260
-
261
-
262
-
263
-
264
-
265
-
266
-
267
-
268
-
269
-
270
-
271
-
272
-
273
-
274
-
275
-
276
 |
 |

155
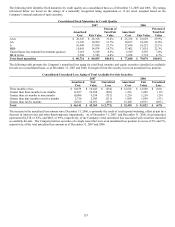
The evaluation for other-than-temporary impairments is a quantitative and qualitative process, which is subject to risks and uncertainties
in the determination of whether declines in the fair value of investments are other-than-temporary. The risks and uncertainties include
changes in general economic conditions, the issuer’ s financial condition or near term recovery prospects and the effects of changes in
interest rates and credit spreads. In addition, for securitized financial assets with contractual cash flows (e.g., ABS and CMBS),
projections of expected future cash flows may change based upon new information regarding the performance of the underlying
collateral. As of December 31, 2007 and 2006, management’ s expectation of the discounted future cash flows on these securities was in
excess of the associated securities’ amortized cost. For a further discussion, see “Evaluation of Other-Than-Temporary Impairments on
Available-for-Sale Securities” included in the “Critical Accounting Estimates” section of the MD&A and “Other-Than-Temporary
Impairments on Available-for-Sale Securities” section in Note 1 of Notes to Consolidated Financial Statements.
CAPITAL MARKETS RISK MANAGEMENT
The Hartford has a disciplined approach to managing risks associated with its capital markets and asset/liability management activities.
Investment portfolio management is organized to focus investment management expertise on the specific classes of investments, while
asset/liability management is the responsibility of a dedicated risk management unit supporting Life and Property & Casualty
operations. Derivative instruments are utilized in compliance with established Company policy and regulatory requirements and are
monitored internally and reviewed by senior management. During 2007, the deterioration in the U.S. housing market, tightened lending
conditions, the market’ s flight to quality securities as well as increased likelihood of a U.S. recession contributed to substantial spread
widening in credit derivatives and structured credit products.
Market Risk
The Hartford is exposed to market risk, primarily relating to the market price and/or cash flow variability associated with changes in
interest rates, credit spreads including issuer defaults, equity prices or market indices, and foreign currency exchange rates. The
Hartford is also exposed to credit and counterparty repayment risk.
Interest Rate Risk
The Company’ s exposure to interest rate risk relates to the market price and/or cash flow variability associated with the changes in
market interest rates. The Company manages its exposure to interest rate risk through asset allocation limits, asset/liability duration
matching and through the use of derivatives. The Company analyzes interest rate risk using various models including parametric
models and cash flow simulation of the liabilities and the supporting investments, including derivative instruments under various market
scenarios. Measures the Company uses to quantify its exposure to interest rate risk inherent in its invested assets and interest rate
sensitive liabilities include duration and key rate duration. Duration is the weighted average term-to-maturity of a security’ s cash flows,
and is used to approximate the percentage change in the price of a security for a 100 basis point change in market interest rates. For
example, a duration of 5 means the price of the security will change by approximately 5% for a 1% change in interest rates. The key
rate duration analysis considers the expected future cash flows of assets and liabilities assuming non-parallel interest rate movements.
To calculate duration, projections of asset and liability cash flows are discounted to a present value using interest rate assumptions.
These cash flows are then revalued at alternative interest rate levels to determine the percentage change in fair value due to an
incremental change in rates. Cash flows from corporate obligations are assumed to be consistent with the contractual payment streams
on a yield to worst basis. The primary assumptions used in calculating cash flow projections include expected asset payment streams
taking into account prepayment speeds, issuer call options and contract holder behavior. ABS, CMOs, and MBS are modeled based on
estimates of the rate of future prepayments of principal over the remaining life of the securities. These estimates are developed using
prepayment speeds provided in broker consensus data. Such estimates are derived from prepayment speeds previously experienced at
the interest rate levels projected for the underlying collateral. Actual prepayment experience may vary from these estimates.
The Company is also exposed to interest rate risk based upon the discount rate assumption associated with the Company’ s pension and
other postretirement benefit obligations. The discount rate assumption is based upon an interest rate yield curve comprised of bonds
rated Aa or higher with maturities primarily between zero and thirty years. For further discussion of interest rate risk associated with
the benefit obligations, see the Critical Accounting Estimates section of the MD&A under “Pension and Other Postretirement Benefit
Obligations” and Note 17 of Notes to Consolidated Financial Statements.
As interest rates decline, certain securities such as MBS and CMO as well as other mortgage loans backed securities are more
susceptible to paydowns and prepayments. During such periods, the Company generally will not be able to reinvest the proceeds at
comparable yields, however in 2007, in general, increases in credit spreads off-set lower interest rates. Lower interest rates will also
likely result in lower net investment income increased hedging cost associated with variable annuities and, if declines are sustained for a
long period of time, it may subject the Company to reinvestment risks, higher pension costs expense and possibly reduced profit
margins associated with guaranteed crediting rates on certain Life products. Conversely, the fair value of the investment portfolio will
increase when interest rates decline and the Company’ s interest expense will be lower on its variable rate debt obligations.
The Company believes that an increase in interest rates from the current levels is generally a favorable development for the Company.
Rate increases are expected to provide additional net investment income, increase sales of fixed rate Life investment products, reduce
the cost of the variable annuity hedging program, limit the potential risk of margin erosion due to minimum guaranteed crediting rates in
certain Life products and, if sustained, could reduce the Company’ s prospective pension expense. Conversely, a rise in interest rates
will reduce the fair value of the investment portfolio, increase interest expense on the Company’ s variable rate debt obligations and, if