The Hartford 2007 Annual Report Download - page 153
Download and view the complete annual report
Please find page 153 of the 2007 The Hartford annual report below. You can navigate through the pages in the report by either clicking on the pages listed below, or by using the keyword search tool below to find specific information within the annual report.-
 1
1 -
2
-
3
-
4
-
5
-
6
-
7
-
8
-
9
-
10
-
11
-
12
-
13
-
14
-
15
-
16
-
17
-
18
-
19
-
20
-
21
-
22
-
23
-
24
-
25
-
26
-
27
-
28
-
29
-
30
-
31
-
32
-
33
-
34
-
35
-
36
-
37
-
38
-
39
-
40
-
41
-
42
-
43
-
44
-
45
-
46
-
47
-
48
-
49
-
50
-
51
-
52
-
53
-
54
-
55
-
56
-
57
-
58
-
59
-
60
-
61
-
62
-
63
-
64
-
65
-
66
-
67
-
68
-
69
-
70
-
71
-
72
-
73
-
74
-
75
-
76
-
77
-
78
-
79
-
80
-
81
-
82
-
83
-
84
-
85
-
86
-
87
-
88
-
89
-
90
-
91
-
92
-
93
-
94
-
95
-
96
-
97
-
98
-
99
-
100
-
101
-
102
-
103
-
104
-
105
-
106
-
107
-
108
-
109
-
110
-
111
-
112
-
113
-
114
-
115
-
116
-
117
-
118
-
119
-
120
-
121
-
122
-
123
-
124
-
125
-
126
-
127
-
128
-
129
-
130
-
131
-
132
-
133
-
134
-
135
-
136
-
137
-
138
-
139
-
140
-
141
-
142
-
 143
143 -
 144
144 -
 145
145 -
 146
146 -
 147
147 -
 148
148 -
 149
149 -
 150
150 -
 151
151 -
 152
152 -
 153
153 -
 154
154 -
 155
155 -
 156
156 -
 157
157 -
 158
158 -
 159
159 -
 160
160 -
 161
161 -
 162
162 -
 163
163 -
164
-
165
-
166
-
167
-
168
-
169
-
170
-
171
-
172
-
173
-
174
-
175
-
176
-
177
-
178
-
179
-
180
-
181
-
182
-
183
-
184
-
185
-
186
-
187
-
188
-
189
-
190
-
191
-
192
-
193
-
194
-
195
-
196
-
197
-
198
-
199
-
200
-
201
-
202
-
203
-
204
-
205
-
206
-
207
-
208
-
209
-
210
-
211
-
212
-
213
-
214
-
215
-
216
-
217
-
218
-
219
-
220
-
221
-
222
-
223
-
224
-
225
-
226
-
227
-
228
-
229
-
230
-
231
-
232
-
233
-
234
-
235
-
236
-
237
-
238
-
239
-
240
-
241
-
242
-
243
-
244
-
245
-
246
-
247
-
248
-
249
-
250
-
251
-
252
-
253
-
254
-
255
-
256
-
257
-
258
-
259
-
260
-
261
-
262
-
263
-
264
-
265
-
266
-
267
-
268
-
269
-
270
-
271
-
272
-
273
-
274
-
275
-
276
 |
 |

153
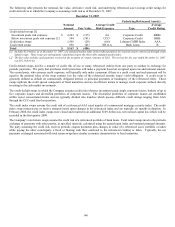
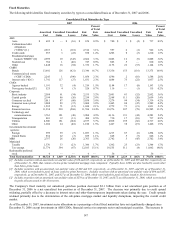
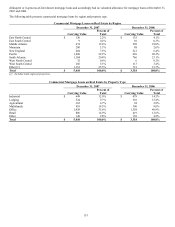
The following table identifies fixed maturities by credit quality on a consolidated basis as of December 31, 2007 and 2006. The ratings
referenced below are based on the ratings of a nationally recognized rating organization or, if not rated, assigned based on the
Company’ s internal analysis of such securities.
Consolidated Fixed Maturities by Credit Quality
2007 2006
Amortized
Cost
Fair Value
Percent of
Total Fair
Value
Amortized
Cost
Fair Value
Percent of
Total Fair
Value
AAA $ 28,547 $ 28,318 35.4% $ 23,216 $ 23,629 29.9%
AA 11,326 10,999 13.7% 10,107 10,298 13.0%
A 16,999 17,030 21.3% 17,696 18,251 23.1%
BBB 15,093 14,974 18.7% 17,402 17,655 22.3%
United States Government/Government agencies 5,165 5,229 6.5% 5,529 5,507 7.0%
BB & below 3,594 3,505 4.4% 3,658 3,734 4.7%
Total fixed maturities $ 80,724 $ 80,055 100.0% $ 77,608 $ 79,074 100.0%
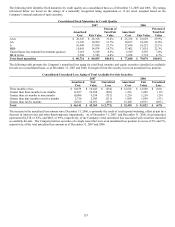
The following table presents the Company’ s unrealized loss aging for total fixed maturity and equity securities classified as available-
for-sale on a consolidated basis, as of December 31, 2007 and 2006, by length of time the security was in an unrealized loss position.
Consolidated Unrealized Loss Aging of Total Available-for-Sale Securities
2007 2006
Amortized
Cost
Fair
Value
Unrealized
Loss
Amortized
Cost
Fair
Value
Unrealized
Loss
Three months or less $ 10,879 $ 10,445 $ (434) $ 12,601 $ 12,500 $ (101)
Greater than three months to six months 11,857 10,954 (903) 1,261 1,242 (19)
Greater than six months to nine months 10,086 9,354 (732) 1,239 1,210 (29)
Greater than nine months to twelve months 2,756 2,545 (211) 1,992 1,959 (33)
Greater than twelve months 10,563 10,071 (492) 15,402 14,911 (491)
Total $ 46,141 $ 43,369 $ (2,772) $ 32,495 $ 31,822 $ (673)
The increase in the unrealized loss amount since December 31, 2006, is primarily the result of credit spread widening, offset in part by a
decrease in interest rates and other-than-temporary impairments. As of December 31, 2007, and December 31, 2006, fixed maturities
represented $2,538, or 92%, and $663, or 99%, respectively, of the Company’ s total unrealized loss associated with securities classified
as available-for-sale. The Company held no securities of a single issuer that were at an unrealized loss position in excess of 2% and 5%,
respectively, of the total unrealized loss amount as of December 31, 2007 and 2006.