The Hartford 2007 Annual Report Download - page 130
Download and view the complete annual report
Please find page 130 of the 2007 The Hartford annual report below. You can navigate through the pages in the report by either clicking on the pages listed below, or by using the keyword search tool below to find specific information within the annual report.-
 1
1 -
2
-
3
-
4
-
5
-
6
-
7
-
8
-
9
-
10
-
11
-
12
-
13
-
14
-
15
-
16
-
17
-
18
-
19
-
20
-
21
-
22
-
23
-
24
-
25
-
26
-
27
-
28
-
29
-
30
-
31
-
32
-
33
-
34
-
35
-
36
-
37
-
38
-
39
-
40
-
41
-
42
-
43
-
44
-
45
-
46
-
47
-
48
-
49
-
50
-
51
-
52
-
53
-
54
-
55
-
56
-
57
-
58
-
59
-
60
-
61
-
62
-
63
-
64
-
65
-
66
-
67
-
68
-
69
-
70
-
71
-
72
-
73
-
74
-
75
-
76
-
77
-
78
-
79
-
80
-
81
-
82
-
83
-
84
-
85
-
86
-
87
-
88
-
89
-
90
-
91
-
92
-
93
-
94
-
95
-
96
-
97
-
98
-
99
-
100
-
101
-
102
-
103
-
104
-
105
-
106
-
107
-
108
-
109
-
110
-
111
-
112
-
113
-
114
-
115
-
116
-
117
-
118
-
119
-
 120
120 -
 121
121 -
 122
122 -
 123
123 -
 124
124 -
 125
125 -
 126
126 -
 127
127 -
 128
128 -
 129
129 -
 130
130 -
 131
131 -
 132
132 -
 133
133 -
 134
134 -
 135
135 -
 136
136 -
 137
137 -
 138
138 -
 139
139 -
 140
140 -
141
-
142
-
143
-
144
-
145
-
146
-
147
-
148
-
149
-
150
-
151
-
152
-
153
-
154
-
155
-
156
-
157
-
158
-
159
-
160
-
161
-
162
-
163
-
164
-
165
-
166
-
167
-
168
-
169
-
170
-
171
-
172
-
173
-
174
-
175
-
176
-
177
-
178
-
179
-
180
-
181
-
182
-
183
-
184
-
185
-
186
-
187
-
188
-
189
-
190
-
191
-
192
-
193
-
194
-
195
-
196
-
197
-
198
-
199
-
200
-
201
-
202
-
203
-
204
-
205
-
206
-
207
-
208
-
209
-
210
-
211
-
212
-
213
-
214
-
215
-
216
-
217
-
218
-
219
-
220
-
221
-
222
-
223
-
224
-
225
-
226
-
227
-
228
-
229
-
230
-
231
-
232
-
233
-
234
-
235
-
236
-
237
-
238
-
239
-
240
-
241
-
242
-
243
-
244
-
245
-
246
-
247
-
248
-
249
-
250
-
251
-
252
-
253
-
254
-
255
-
256
-
257
-
258
-
259
-
260
-
261
-
262
-
263
-
264
-
265
-
266
-
267
-
268
-
269
-
270
-
271
-
272
-
273
-
274
-
275
-
276
 |
 |

130
Reserve Activity
Reserves and reserve activity in the Other Operations segment are categorized and reported as asbestos, environmental, or “all other”.
The “all other” category of reserves covers a wide range of insurance and assumed reinsurance coverages, including, but not limited to,
potential liability for construction defects, lead paint, silica, pharmaceutical products, molestation and other long-tail liabilities. In
addition, within the “all other” category of reserves, Other Operations records its allowance for future reinsurer insolvencies and
disputes that might affect reinsurance collectibility associated with asbestos, environmental, and other claims recoverable from
reinsurers.
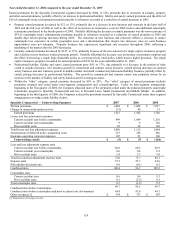
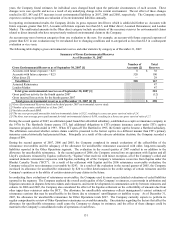
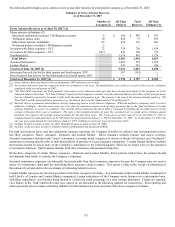
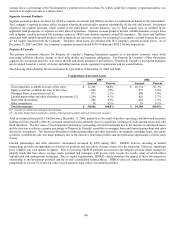
The following table presents reserve activity, inclusive of estimates for both reported and incurred but not reported claims, net of
reinsurance, for Other Operations, categorized by asbestos, environmental and all other claims, for the years ended December 31, 2007,
2006 and 2005.
Other Operations Losses and Loss Adjustment Expenses
2007 Asbestos Environmental All Other [1][6] Total
Beginning liability – net [2] [3] $ 2,242 $ 316 $ 1,858 $ 4,416
Losses and loss adjustment expenses incurred 43 28 122 193
Losses and loss adjustment expenses paid
Reallocation of reserves for unallocated loss adjustment
expenses [4]
(287)
—
(93)
—
(217)
125
(597)
125
Ending liability – net [2] [3] $ 1,998[5] $ 251 $ 1,888 $ 4,137
2006
Beginning liability – net [2] [3] $ 2,291 $ 360 $ 2,240 $ 4,891
Losses and loss adjustment expenses incurred 314 62 (16) 360
Losses and loss adjustment expenses paid (363) (106) (366) (835)
Ending liability – net [2] [3] $ 2,242 $ 316 $ 1,858 $ 4,416
2005
Beginning liability – net [2] [3] $ 2,471 $ 385 $ 2,514 $ 5,370
Losses and loss adjustment expenses incurred 29 52 131 212
Losses and loss adjustment expenses paid (209) (77) (405) (691)
Ending liability – net [2] [3] $ 2,291 $ 360 $ 2,240 $ 4,891
[1] “All Other” includes unallocated loss adjustment expense reserves and the allowance for uncollectible reinsurance.
[2] Excludes asbestos and environmental net liabilities reported in Ongoing Operations of $9 and $6, respectively, as of December 31, 2007, $9 and
$6, respectively, as of December 31, 2006, and $10 and $6, respectively, as of December 31, 2005. Total net losses and loss adjustment expenses
incurred in Ongoing Operations for the years ended December 31, 2007, 2006 and 2005 includes $10, $11 and $11, respectively, related to
asbestos and environmental claims. Total net losses and loss adjustment expenses paid in Ongoing Operations for the years ended December 31,
2007, 2006 and 2005 includes $10, $12 and $17, respectively, related to asbestos and environmental claims.
[3] Gross of reinsurance, asbestos and environmental reserves, including liabilities in Ongoing Operations, were $2,707 and $290, respectively, as of
December 31, 2007, $3,242 and $362, respectively, as of December 31, 2006, and $3,845 and $432, respectively, as of December 31, 2005.
[4] Prior to the second quarter of 2007, the Company evaluated the adequacy of the reserves for unallocated loss adjustment expenses on a company-
wide basis. During the second quarter of 2007, the Company refined its analysis of the reserves at the segment level, resulting in the reallocation
of reserves among segments, including a reallocation of reserves from Ongoing Operations to Other Operations.
[5] The one year and average three year net paid amounts for asbestos claims, including Ongoing Operations, were $291 and $291, respectively,
resulting in a one year net survival ratio of 6.9 and a three year net survival ratio of 6.9. Net survival ratio is the quotient of the net carried
reserves divided by the average annual payment amount and is an indication of the number of years that the net carried reserve would last (i.e.
survive) if the future annual claim payments were consistent with the calculated historical average.
[6] The Company includes its allowance for uncollectible reinsurance in the “All Other” category of reserves. When the Company commutes a ceded
reinsurance contract or settles a ceded reinsurance dispute, the portion of the allowance for uncollectible reinsurance attributable to that
commutation or settlement, if any, is reclassified to the appropriate cause of loss.
The Company has been evaluating and closely monitoring assumed reinsurance reserves in Other Operations. With the transfer of
certain assumed reinsurance business into Other Operations, the segment has exposure related to more recent assumed casualty
reinsurance reserves, particularly for the underwriting years 1997 through 2001. Assumed reinsurance exposures are inherently less
predictable than direct insurance exposures because the Company may not receive notice of a reinsurance claim until the underlying
direct insurance claim is mature. This causes a delay in the receipt of information from the ceding companies. In 2005 and 2006, the
Company saw an increase in reported losses above previous expectations and this increase in reported losses contributed to reserve re-
estimates. As a result of these unfavorable trends, for the years ended December 31, 2006 and 2005, the Company booked unfavorable
reserve development of $12 and $85, respectively, related to assumed reinsurance. In the fourth quarter 2007, the Company completed
an evaluation of certain of its non-asbestos and environmental reserves, including its assumed reinsurance liabilities. The evaluation
indicated no significant change in the Company’ s overall non-asbestos and environmental reserves.
During the third quarters of 2007, 2006 and 2005, the Company completed its annual ground up environmental reserve evaluations. In
each of these evaluations, the Company reviewed all of its open direct domestic insurance accounts exposed to environmental liability as
well as assumed reinsurance accounts and its London Market exposures for both direct insurance and assumed reinsurance. In all three