The Hartford 2007 Annual Report Download - page 216
Download and view the complete annual report
Please find page 216 of the 2007 The Hartford annual report below. You can navigate through the pages in the report by either clicking on the pages listed below, or by using the keyword search tool below to find specific information within the annual report.-
 1
1 -
2
-
3
-
4
-
5
-
6
-
7
-
8
-
9
-
10
-
11
-
12
-
13
-
14
-
15
-
16
-
17
-
18
-
19
-
20
-
21
-
22
-
23
-
24
-
25
-
26
-
27
-
28
-
29
-
30
-
31
-
32
-
33
-
34
-
35
-
36
-
37
-
38
-
39
-
40
-
41
-
42
-
43
-
44
-
45
-
46
-
47
-
48
-
49
-
50
-
51
-
52
-
53
-
54
-
55
-
56
-
57
-
58
-
59
-
60
-
61
-
62
-
63
-
64
-
65
-
66
-
67
-
68
-
69
-
70
-
71
-
72
-
73
-
74
-
75
-
76
-
77
-
78
-
79
-
80
-
81
-
82
-
83
-
84
-
85
-
86
-
87
-
88
-
89
-
90
-
91
-
92
-
93
-
94
-
95
-
96
-
97
-
98
-
99
-
100
-
101
-
102
-
103
-
104
-
105
-
106
-
107
-
108
-
109
-
110
-
111
-
112
-
113
-
114
-
115
-
116
-
117
-
118
-
119
-
120
-
121
-
122
-
123
-
124
-
125
-
126
-
127
-
128
-
129
-
130
-
131
-
132
-
133
-
134
-
135
-
136
-
137
-
138
-
139
-
140
-
141
-
142
-
143
-
144
-
145
-
146
-
147
-
148
-
149
-
150
-
151
-
152
-
153
-
154
-
155
-
156
-
157
-
158
-
159
-
160
-
161
-
162
-
163
-
164
-
165
-
166
-
167
-
168
-
169
-
170
-
171
-
172
-
173
-
174
-
175
-
176
-
177
-
178
-
179
-
180
-
181
-
182
-
183
-
184
-
185
-
186
-
187
-
188
-
189
-
190
-
191
-
192
-
193
-
194
-
195
-
196
-
197
-
198
-
199
-
200
-
201
-
202
-
203
-
204
-
205
-
 206
206 -
 207
207 -
 208
208 -
 209
209 -
 210
210 -
 211
211 -
 212
212 -
 213
213 -
 214
214 -
 215
215 -
 216
216 -
 217
217 -
 218
218 -
 219
219 -
 220
220 -
 221
221 -
 222
222 -
 223
223 -
 224
224 -
 225
225 -
 226
226 -
227
-
228
-
229
-
230
-
231
-
232
-
233
-
234
-
235
-
236
-
237
-
238
-
239
-
240
-
241
-
242
-
243
-
244
-
245
-
246
-
247
-
248
-
249
-
250
-
251
-
252
-
253
-
254
-
255
-
256
-
257
-
258
-
259
-
260
-
261
-
262
-
263
-
264
-
265
-
266
-
267
-
268
-
269
-
270
-
271
-
272
-
273
-
274
-
275
-
276
 |
 |

THE HARTFORD FINANCIAL SERVICES GROUP, INC.
NOTES TO CONSOLIDATED FINANCIAL STATEMENTS (continued)
F-39
4. Investments and Derivative Instruments (continued)
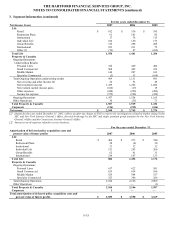
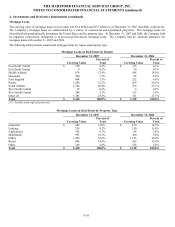
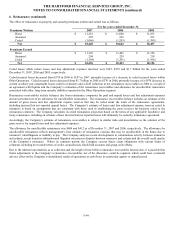
Mortgage Loans
The carrying value of mortgage loans on real estate was $5.4 billion and $3.3 billion as of December 31, 2007 and 2006, respectively.
The Company’ s mortgage loans are collateralized by a variety of commercial and agricultural properties. The mortgage loans are
diversified both geographically throughout the United States and by property type. At December 31, 2007 and 2006, the Company held
no impaired, restructured, delinquent or in-process-of-foreclosure mortgage loans. The Company had no valuation allowance for
mortgage loans at December 31, 2007 and 2006.
The following table presents commercial mortgage loans by region and property type.
Mortgage Loans on Real Estate by Region
December 31, 2007 December 31, 2006
Carrying Value
Percent of
Total Carrying Value
Percent of
Total
East North Central $ 120 2.2% $ 135 4.1%
East South Central 9 0.2% 10 0.3%
Middle Atlantic 674 12.4% 598 18.0%
Mountain 200 3.7%
88 2.6%
New England 404 7.5%
212 6.4%
Pacific 1,200 22.2%
669 20.2%
South Atlantic 1,104 20.4%
766 23.1%
West North Central 32 0.6% 6 0.2%
West South Central 286 5.3% 113 3.4%
Other [1] 1,381 25.5%
721 21.7%
Total $ 5,410 100.0% $ 3,318 100.0%
[1] Includes multi-regional properties.
Mortgage Loans on Real Estate by Property Type
December 31, 2007 December 31, 2006
Carrying Value
Percent of
Total Carrying Value
Percent of
Total
Industrial $ 649 12.0% $ 479 14.5%
Lodging 524 9.7% 510 15.4%
Agricultural 362 6.7% 94 2.8%
Multifamily 991 18.3%
300 9.0%
Office 1,929 35.6%
1,358 40.9%
Retail 806 14.9%
419 12.6%
Other 149 2.8%
158 4.8%
Total $ 5,410 100.0% $ 3,318 100.0%