The Hartford 2007 Annual Report Download - page 63
Download and view the complete annual report
Please find page 63 of the 2007 The Hartford annual report below. You can navigate through the pages in the report by either clicking on the pages listed below, or by using the keyword search tool below to find specific information within the annual report.
63
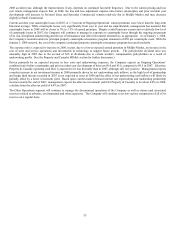
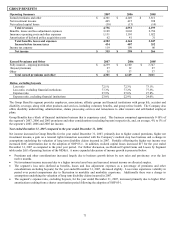
RETAIL
Operating Summary 2007 2006 2005
Fee income and other $3,117 $ 2,695 $2,324
Earned premiums (62) (86) (52)
Net investment income 801 839 933
Net realized capital losses (381) (87) (38)
Total revenues 3,475 3,361 3,167
Benefits, losses and loss adjustment expenses 820 819 895
Insurance operating costs and other expenses 1,221 994 867
Amortization of deferred policy acquisition costs
and present value of future profits
406
973
740
Total benefits, losses and expenses 2,447 2,786 2,502
Income before income taxes 1,028 575 665
Income tax expense 216 39 70
Net income $812 $ 536 $595
Assets Under Management
2007
2006
2005
Individual variable annuity account values $119,071 $ 114,365 $105,314
Individual fixed annuity and other account values 10,243 9,937 10,222
Other retail products account values 677 525 336
Total account values [1] 129,991 124,827 115,872
Retail mutual fund assets under management 48,383 38,536 29,063
Other mutual fund assets under management 2,113 1,489 1,004
Total mutual fund assets under management 50,496 40,025 30,067
Total assets under management $180,487 $ 164,852 $145,939
[1] Includes policyholders’ balances for investment contracts and reserve for future policy benefits for insurance contracts.
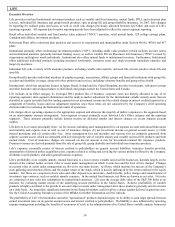
Retail focuses on the savings and retirement needs of the growing number of individuals who are preparing for retirement, or have
already retired, through the sale of individual variable and fixed annuities, mutual funds and other investment products. Life is both a
large writer and seller of individual variable annuities and a top seller of individual variable annuities throughout banks in the United
States.
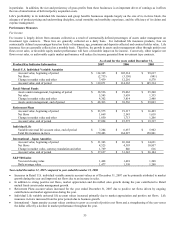
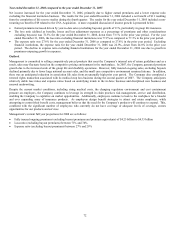
Year ended December 31, 2007 compared to the year ended December 31, 2006
Net income in Retail increased for the year ended December 31, 2007, primarily driven by lower amortization of DAC resulting from
the unlock benefit in the third quarter of 2007, fee income growth in the variable annuity and mutual fund businesses, partially offset by
increased non-deferrable individual annuity asset based commissions and mutual fund commissions In addition, realized capital losses
increased $294 for the year ended December 31, 2007 as compared to the prior year period. For further discussion, see Realized Capital
Gains and Losses by Segment table under Life’ s Operating Section of the MD&A. A more expanded discussion of income growth is
presented below:
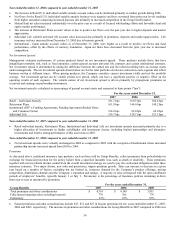
• Fee income increased for the year ended December 31, 2007 primarily as a result of growth in variable annuity average account
values. The year-over-year increase in average variable annuity account values can be attributed to market appreciation of $7.4
billion during the year. Variable annuities had net outflows of $2.7 billion in 2007. Net outflows were driven by surrender activity
due to the aging of the variable annuity inforce block of business and increased sales competition, particularly competition related
to guaranteed living benefits.
• Mutual fund fee income increased 23% for the year ended December 31, 2007 due to increased assets under management driven by
net sales of $5.5 billion and market appreciation of $4.4 billion during 2007.
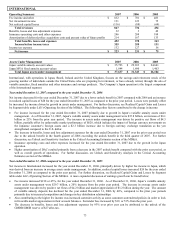
• Net investment income has declined for the year ended December 31, 2007 due to a decrease in variable annuity fixed option
account values of 11% or $635. The decrease in these account values can be attributed to a combination of transfers into separate
accounts and surrender activity. Offsetting this decrease in net investment income was an increase in the returns on partnership
income of $14 for the year ended December 31, 2007.
• Insurance operating costs and other expenses increased for the year ended December 31, 2007. These increases were principally
driven by mutual fund commission increases of $75 for the year ended December 31, 2007 due to growth in deposits of 29%. In
addition, non-deferrable variable annuity asset based commissions increased $67 for the year ended December 31, 2007 due to a
4% growth in assets under management, as well as an increase in the number of contracts reaching anniversaries when trail
commission payments begin.
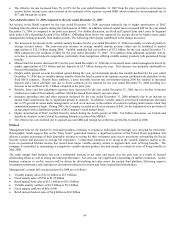
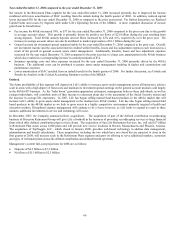
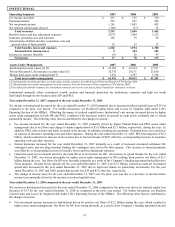
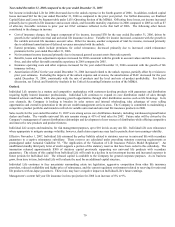
• Lower amortization of DAC resulted from the unlock benefit during the third quarter of 2007 as compared to an unlock expense
during the fourth quarter of 2006. For further discussion, see Unlock and Sensitivity Analysis in the Critical Accounting Estimates
section of the MD&A.


