The Hartford 2007 Annual Report Download - page 139
Download and view the complete annual report
Please find page 139 of the 2007 The Hartford annual report below. You can navigate through the pages in the report by either clicking on the pages listed below, or by using the keyword search tool below to find specific information within the annual report.-
 1
1 -
2
-
3
-
4
-
5
-
6
-
7
-
8
-
9
-
10
-
11
-
12
-
13
-
14
-
15
-
16
-
17
-
18
-
19
-
20
-
21
-
22
-
23
-
24
-
25
-
26
-
27
-
28
-
29
-
30
-
31
-
32
-
33
-
34
-
35
-
36
-
37
-
38
-
39
-
40
-
41
-
42
-
43
-
44
-
45
-
46
-
47
-
48
-
49
-
50
-
51
-
52
-
53
-
54
-
55
-
56
-
57
-
58
-
59
-
60
-
61
-
62
-
63
-
64
-
65
-
66
-
67
-
68
-
69
-
70
-
71
-
72
-
73
-
74
-
75
-
76
-
77
-
78
-
79
-
80
-
81
-
82
-
83
-
84
-
85
-
86
-
87
-
88
-
89
-
90
-
91
-
92
-
93
-
94
-
95
-
96
-
97
-
98
-
99
-
100
-
101
-
102
-
103
-
104
-
105
-
106
-
107
-
108
-
109
-
110
-
111
-
112
-
113
-
114
-
115
-
116
-
117
-
118
-
119
-
120
-
121
-
122
-
123
-
124
-
125
-
126
-
127
-
128
-
 129
129 -
 130
130 -
 131
131 -
 132
132 -
 133
133 -
 134
134 -
 135
135 -
 136
136 -
 137
137 -
 138
138 -
 139
139 -
 140
140 -
 141
141 -
 142
142 -
 143
143 -
 144
144 -
 145
145 -
 146
146 -
 147
147 -
 148
148 -
 149
149 -
150
-
151
-
152
-
153
-
154
-
155
-
156
-
157
-
158
-
159
-
160
-
161
-
162
-
163
-
164
-
165
-
166
-
167
-
168
-
169
-
170
-
171
-
172
-
173
-
174
-
175
-
176
-
177
-
178
-
179
-
180
-
181
-
182
-
183
-
184
-
185
-
186
-
187
-
188
-
189
-
190
-
191
-
192
-
193
-
194
-
195
-
196
-
197
-
198
-
199
-
200
-
201
-
202
-
203
-
204
-
205
-
206
-
207
-
208
-
209
-
210
-
211
-
212
-
213
-
214
-
215
-
216
-
217
-
218
-
219
-
220
-
221
-
222
-
223
-
224
-
225
-
226
-
227
-
228
-
229
-
230
-
231
-
232
-
233
-
234
-
235
-
236
-
237
-
238
-
239
-
240
-
241
-
242
-
243
-
244
-
245
-
246
-
247
-
248
-
249
-
250
-
251
-
252
-
253
-
254
-
255
-
256
-
257
-
258
-
259
-
260
-
261
-
262
-
263
-
264
-
265
-
266
-
267
-
268
-
269
-
270
-
271
-
272
-
273
-
274
-
275
-
276
 |
 |
139
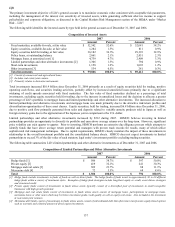
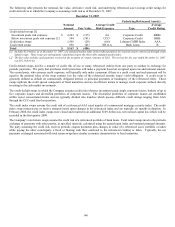
and a lower expected yield from limited partnership and other alternative investments, Life expects the average portfolio yield in 2008
to modestly decline compared to 2007 levels. The Company expects a lower yield from limited partnerships and other alternative
investments primarily due to reduced liquidity and the wider credit spread environment.
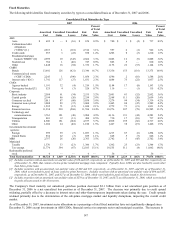
Net investment income on equity securities, held for trading, for the year ended December 31, 2007 were primarily attributed to a
change in the value of the underlying investment funds supporting the Japanese variable annuity product due to market performance.
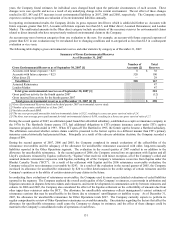
Net realized capital losses were higher for the year ending December 31, 2007. The change in net gains and losses was primarily the
result of higher net losses on impairments, GMWB derivatives, and other net losses offset by higher net gains on sale of investments.
The circumstances giving rise to the changes in these components are as follows:
• See the Other-Than-Temporary Impairments section that follows for information on impairment losses.
• An increase in losses in 2007 compared to 2006 on GMWB rider embedded derivatives was primarily due to liability model
assumption updates and modeling refinements made in 2007, including those for dynamic lapse behavior and correlations of market
returns across underlying indices, as well as those to reflect newly reliable market inputs for volatility. For a further discussion of
the GMWB rider valuation assumption, see the Capital Markets Risk management section of the MD&A under “Market Risk –
Life”.
• Other, net losses in both 2007 and 2006 primarily resulted from the change in value of non-qualifying derivatives due to
fluctuations in credit spreads, interest rates, and equity markets. The increase in net losses in 2007 compared to the prior year was
primarily due to changes in value associated with credit derivatives due to credit spreads widening. Credit spreads widened
primarily due to the deterioration in the U.S. housing market, tightened lending conditions, the market’ s flight to quality securities
as well as increased likelihood of a U.S. recession. For further discussion, see the “Capital Market Risk Management” section of
the MD&A.
Gross gains on sales for the year ended December 31, 2007, were primarily within fixed maturities and were largely comprised of
corporate securities. The sales were made to reallocate the portfolio to securities with more favorable risk-return profiles. The gains on
sales were primarily the result of changes in credit spreads, foreign currency exchange rates, and interest rates from the date of purchase.
Gross losses on sales for the year ended December 31, 2007, were predominantly within fixed maturities and were primarily corporate
securities. No single security was sold at a loss in excess of $5 and an average loss as a percentage of the fixed maturity’ s amortized
cost of less than 3%, which, under the Company’ s impairment policy was deemed to be depressed only to a minor extent.
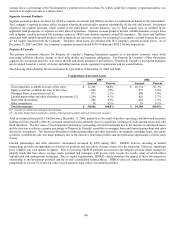
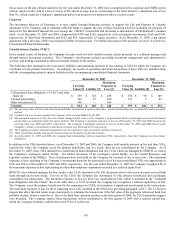
Year ended December 31, 2006 compared to the year ended December 31, 2005
Net investment income, excluding equity securities held for trading and policy loans, increased $188, or 7%, compared to the prior year
period. The increase in net investment income was primarily due to income earned on a higher average invested assets base, an increase
in interest rates and a change in asset mix (i.e., greater investment in mortgage loans and limited partnerships). The increase in the
average invested assets base, as compared to the prior year, was primarily due to positive operating cash flows, investment contract
sales such as retail and institutional notes, and universal life-type product sales.
Net investment income on equity securities held for trading for the year ended December 31, 2006, can be primarily attributed to an
increase in the value of the underlying investment funds supporting the Japanese variable annuity product generated by positive market
performance.
For 2006, the yield on average invested assets increased slightly over the prior year. An increase in the yield on fixed maturities was
offset by a decrease in the yield on limited partnerships.
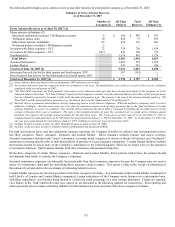
Total net realized capital losses were higher in 2006 compared to 2005 primarily as a result of a higher interest rate environment. The
components that drove the increase in net losses during the year ended December 31, 2006 included net losses on sales of fixed maturity
securities, other-than-temporary impairments, and losses in Other, net, partially offset by a decrease in losses associated with GMWB
derivatives. The circumstances giving rise to these components are as follows:
• The net losses on fixed maturity sales for the year ended December 31, 2006 were primarily the result of rising interest rates from
the date of security purchase and, to a lesser extent, credit spread widening on certain issuers that were sold. For further discussion
of gross gains and losses, see the following discussion below.
• Other, net losses were primarily driven from the change in value of non-qualifying derivatives due to fluctuations in interest rates
and foreign currency exchange rates. These losses were partially offset by a before-tax benefit of $25 received from the WorldCom
security settlement.
• See the Other-Than-Temporary Impairments section that follows for information on impairment losses.
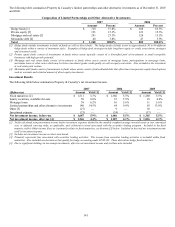
Gross gains on sales for the year ended December 31, 2006, were primarily within fixed maturities and were concentrated in U.S.
government, corporate and foreign government securities. Certain sales were made to reposition the portfolio to a shorter duration due
to the flatness of the yield curve and the lack of market compensation for longer duration assets. Also, certain sales were made as the
Company continues to increase investments in mortgage loans and limited partnerships. The gains on sales were primarily the result of
changes in interest rates and foreign currency exchange from the date of security purchase.
Gross losses on sales for the year ended December 31, 2006, were primarily within fixed maturities and were concentrated in the
corporate and commercial mortgage-backed securities (“CMBS”) sectors with no single security sold at a loss in excess of $6, and an